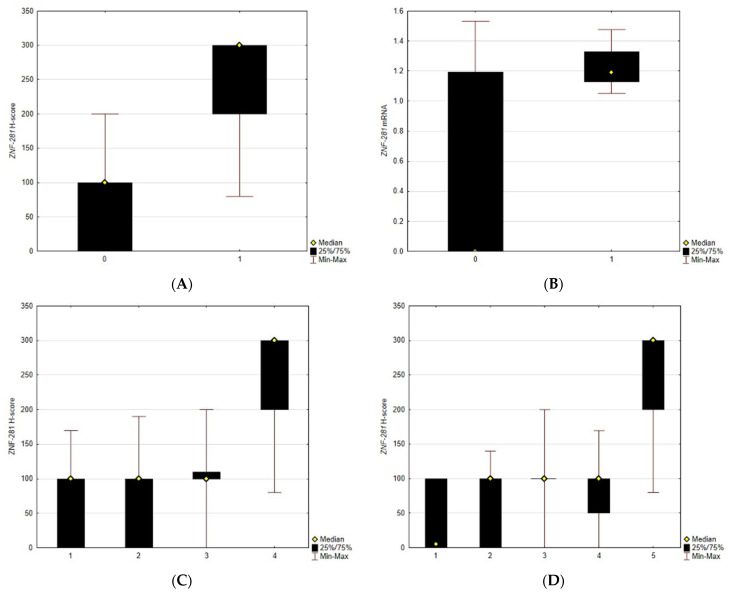
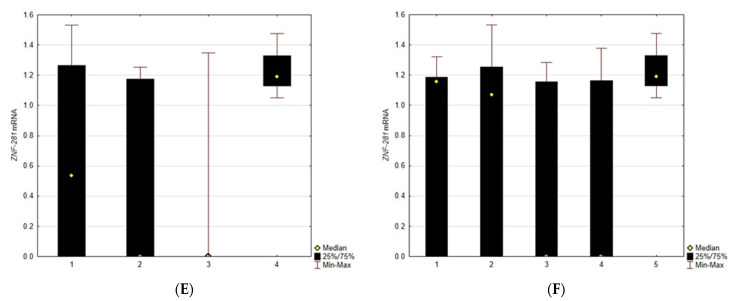
Figure 2.
(A) Comparison of ZNF-281 H-score between OSCC and control, p < 0.001. (B) Comparison of ZNF-281 mRNA transcript level between OSCC and control, p = 0.0011. (C) Comparison of ZNF-281 H-score in grades (1–3) and control. (D) Comparison of ZNF-281 H-score level in stages (1–4) and control. (E) Comparison of ZNF-281 mRNA level in grades (1–3) and control. (F) Comparison of ZNF-281 mRNA level in stages (1–4) and control.


