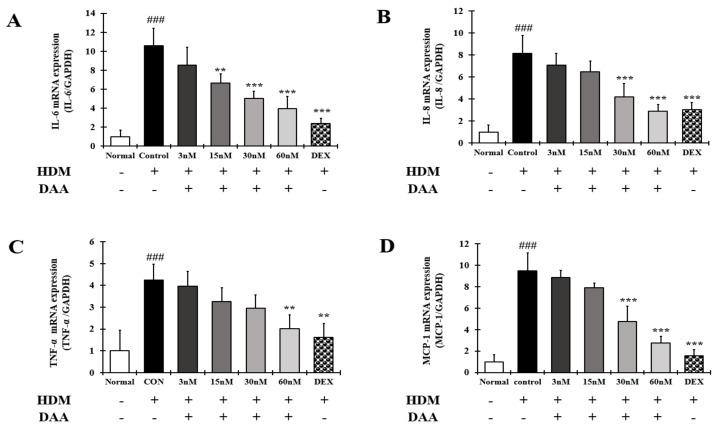
Figure 15.
Effect of DAA on the gene expression levels of AD-related cytokines and chemokines in EOL-1 cells. The gene expression levels of IL-6 (A), IL-8 (B), TNF-α (C), and MCP-1 (D) are shown. Total RNA was isolated from EOL-1 cells and analyzed by RT-qPCR. The expression levels were normalized to that of GAPDH. The results are expressed as the mean ± SD (n = 4). ### p < 0.001 vs. normal; ** p < 0.01 and *** p < 0.001 vs. control. DAA was used at 3 nM, 15 nM, 30 nM, and 60 nM. DEX, the positive control, was used at 2 nM.

