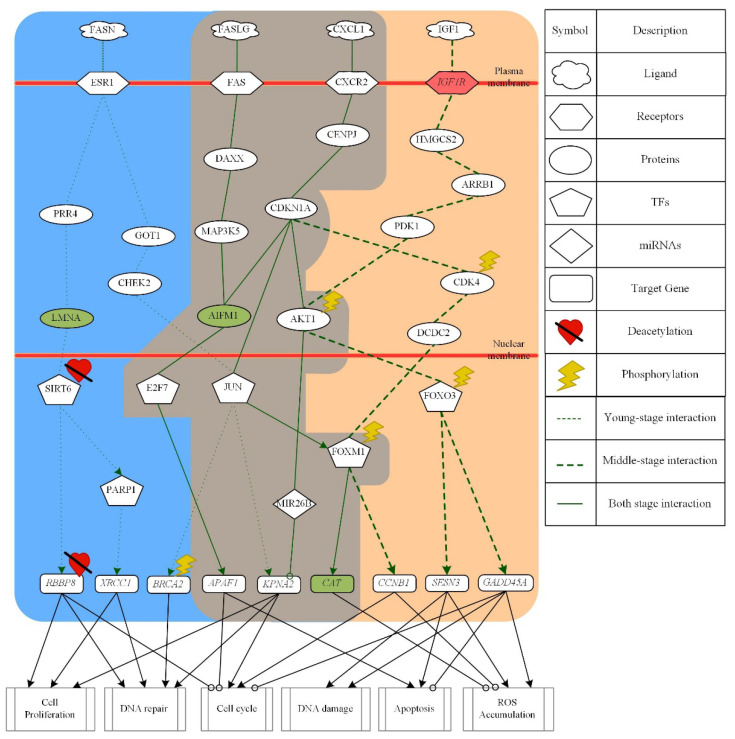
Figure 4.
The core signaling pathways from young-adult to middle-aged skin aging. The green dot lines denote the signaling pathways in young-adult skin; the green dash lines represent the signaling pathways in middle-aged skin; the green solid lines indicate the signaling pathways in both stage; the green lines with arrow heads are upregulation (positive regulation); the green lines with circular heads are downregulation (negative regulation); the black solid lines with arrow heads mean activating cellular function; the black solid lines with circular heads mean inhibiting cellular function; the selected red target gene nodes indicate a higher gene expression in middle-aged skin compared with young-adult skin; the selected green target gene nodes indicate a lower gene expression in middle-aged skin compared with young-adult skin; the blue background shows young-adult skin; the brown background shows the overlap between young-adult and middle-aged skin; the skin color background shows middle-aged skin.

