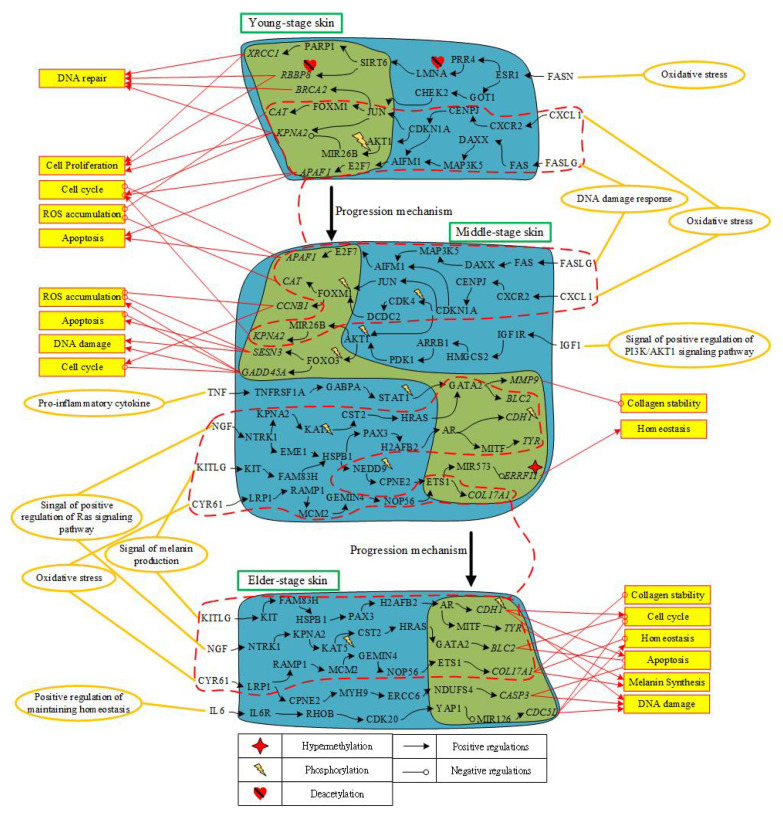
Figure 6.
The overview of human skin aging molecular progression mechanisms from young-adult to middle-aged and then elderly skin aging. This figure summarizes the genetic and epigenetic progression mechanisms of skin aging in Figure 4 and Figure 5. The upper horizontal part is the genetic and epigenetic progression mechanism from young-adult skin to middle-aged skin; the middle part indicates the genetic and epigenetic progression mechanisms from middle-aged skin to elderly skin; the red rectangle with orange background represents cellular functions; the yellow ellipse circles are microenvironment factors; the red dash lines surround the pathways and biomarkers that appear in two consecutive stages of skin; the black arrow lines represent the protein–protein interaction or transcriptional regulation; the black lines with circle head represent inhibit or downregulation; the red arrow lines represent the genes to induce cellular function; the red lines with circle head represent the genes to repress cellular function.

