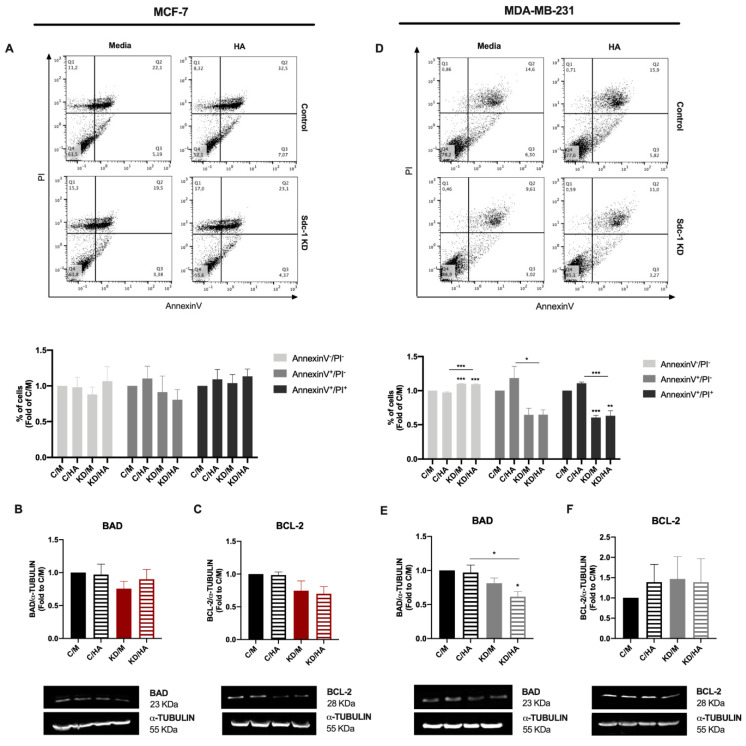
Figure 5.
Sdc-1 deficient MDA-MB-231 cells have an anti-apoptotic profile in BAD and BCL-2 protein expression. (A,D) Apoptosis was determined after Sdc-1 depletion and 96 h of 50 μg/mL HA treatment by annexin V and PI staining by flow cytometry, and the percentage of viable (annexin V−/PI−), early apoptotic (annexin V+/PI−), and late apoptotic (annexin V+/PI+) cells are plotted as fold of C/M (n = 5 MCF-7, n = 3 MDA-MB-231). Representative dot plots are shown. (B–C,E–F) Pro-apoptotic BAD (B,E) and anti-apoptotic BCL-2 (C,F) protein levels were analyzed after Sdc-1 depletion and 48 h of 50 μg/mL HA treatment by Western blot, normalized to α-TUBULIN levels, and plotted as fold of C/M (n = 4 MCF-7, n = 4 MDA-MB-231). Representative bands are shown. Data represent mean ± SEM. Asterisks on the top of the bars mean a significant difference between C/M and all the conditions. The line over the bars indicates a significant difference between C/HA and KD/M and KD/HA (* p < 0.05, ** p < 0.01, *** p < 0.001). C/M: control; C/HA: control plus hyaluronic acid treatment; KD/M: Sdc-1 knockdown; KD/HA: Sdc-1 knockdown plus hyaluronic acid treatment.

