Figure 6.
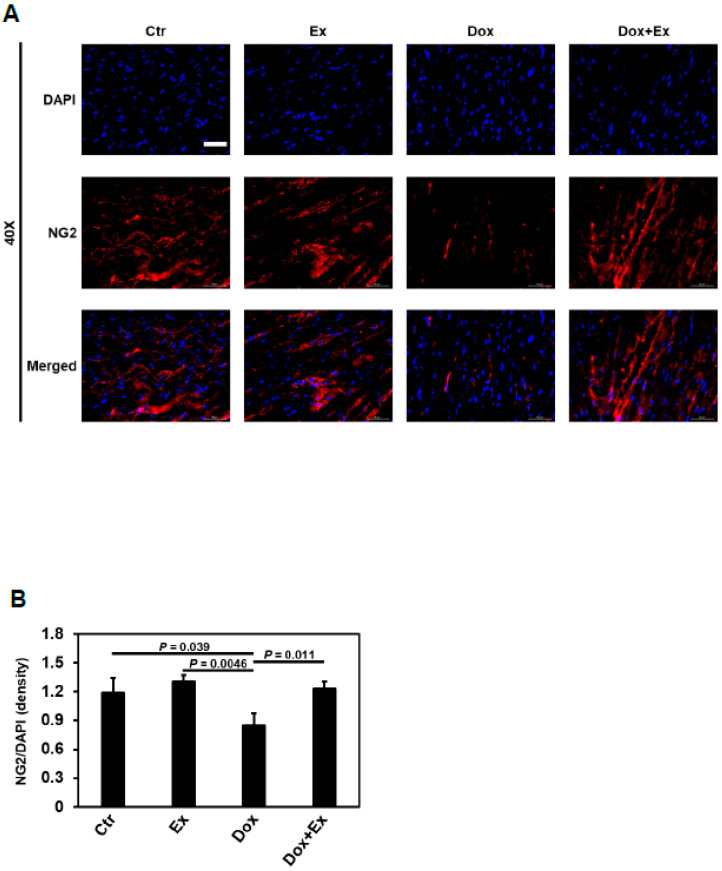
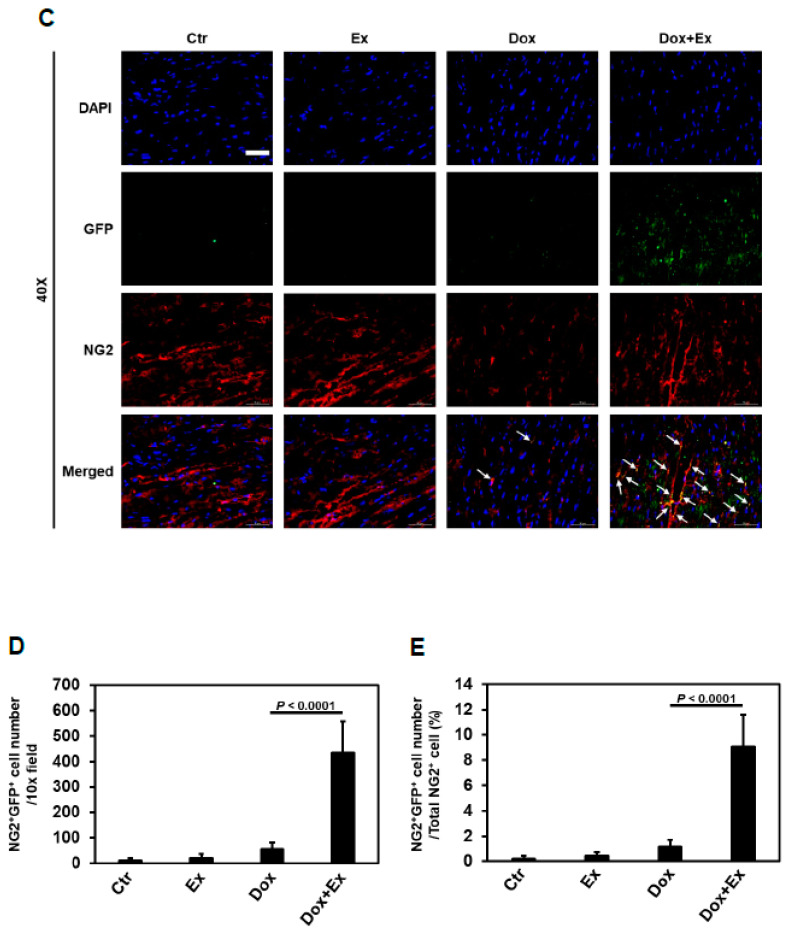
Exercise promotes differentiation of BM stem cells into pericytes after Dox treatment. (A) Representative immunofluorescence images of heart sections stained for DAPI (blue) and NG2 (red) from Ctr, Ex, Dox, and Dox+Ex group mice. Magnification, 40×; Scale bar, 50 µm. (B) Quantification of NG2-positive cells normalized to DAPI (density) in heart tissues from Ctr, Ex, Dox, and Dox+Ex group mice. N = 5 mice/group, 3 slides/mouse. Values represent mean ± SEM. P values are indicated by the Student’s t test. Ctr vs Dox+Ex, not statistically significant. (C) Representative immunofluorescence images of heart sections stained for DAPI (blue), GFP (green), and NG2 (red) from Ctr, Ex, Dox, and Dox+Ex group mice. Arrows indicate colocalization (yellow) of GFP (green), and NG2 (red). Magnification, 40×; Scale bar, 50 µm. (D) Quantification of NG2 and GFP double-positive cells in heart tissues per 10× field from Ctr, Ex, Dox, and Dox+Ex group mice. N = 5 mice/group, 3 slides/mouse. Values represent mean ± SEM. p values are indicated by the Student’s t test. (E) Quantification of percentage of NG2 and GFP double-positive cells to total NG2-positive cells in heart tissues from Ctr, Ex, Dox, and Dox+Ex group mice. N = 5 mice/group, 3 slides/mouse. Values represent mean ± SEM. p values are indicated by the Student’s t test.


