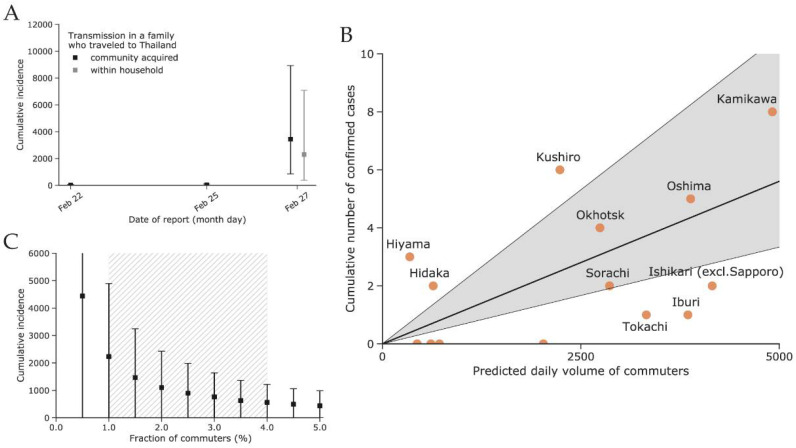
Figure 3.
(A) Estimated cumulative incidence of coronavirus disease 2019 (COVID-2019) in Hokkaido using the count of imported cases either internationally or domestically outbound from Hokkaido (method (i)). (B) Modeled daily volume of commuters and observed incidence of COVID-19 by subprefecture of diagnosis. The four subprefectures with zero case counts are Rumoi, Soya, Nemuro, and Shiribeshi (from left to right). (C) Estimated cumulative incidence in Sapporo as of 29 February with a varying fraction of commuters (method (ii)). The plausible range between 0.5% and 4% is indicated by the hatched grey area. The square points in (A,C) indicate the estimated mean, whereas the error bars indicate the 95% confidence intervals.

