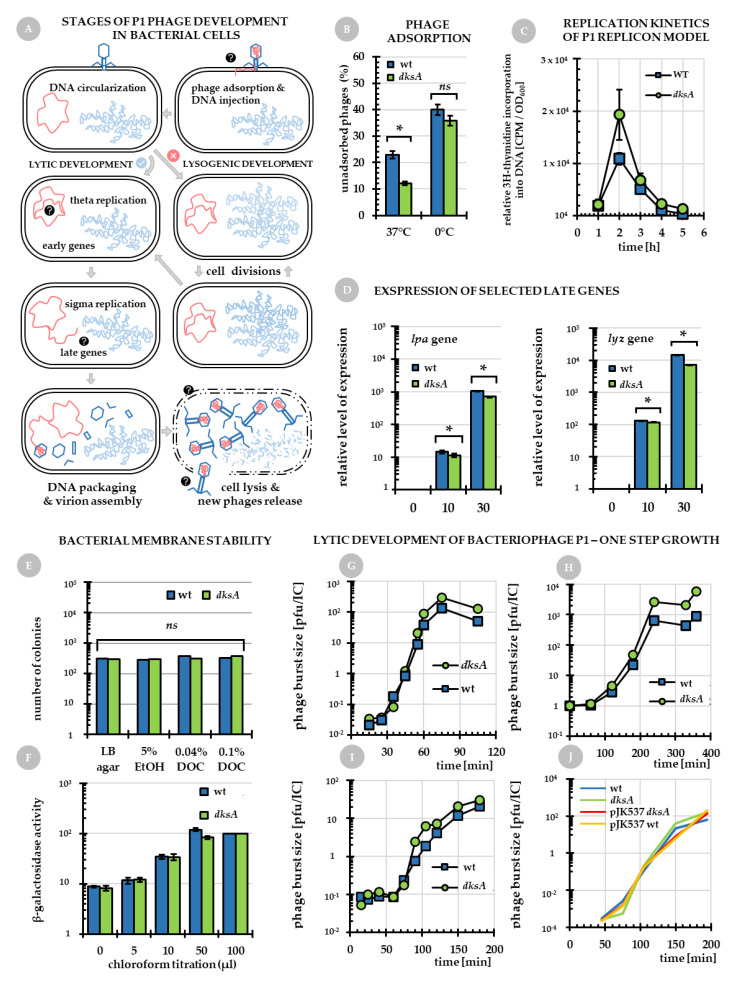
Figure 2.
Analysis of selected aspects of P1vir phage biology in different hosts. (A) General overview of P1 phage development in E. coli. Question marks denote hypothetical points in phage/host biology where changes may lead to the observed phenomenon of improved P1vir development in a dksA mutant vs. the wild type strain. These points were experimentally verified and the results are shown in following panels. (B) Efficiency of P1 phage adsorption on wild type (blue columns) and dksA (green columns) strains presented as percentage of unadsorbed phages at indicated temperatures. (C) The efficiency of pSP102 DNA synthesis, a bacteriophage P1 replicon (the experiment was performed during the exponential phase of growth; compare Figure A1). Panel (D) shows expression levels of phage genes encoding late promoter activator (lpa) and lysozyme (lyz) during P1vir infection of the wild type and dksA mutant cells. Gene expression at 10 min and 30 min of infection was compared to time 0 in the corresponding strains (note the log expression scales). (E,F) Data obtained for the host membrane stability tests. (E) Colony formation efficiency of the wild type and dksA strains. Bacteria were cultured in LB and then were diluted and plated on LB agar plates containing indicated concentrations of ethanol (EtOH) or sodium deoxycholate (DOC). (F) The relative β-galactosidase activity of the wild type and dksA strains treated with different amounts of chloroform. β-galactosidase activity that was assessed in samples treated with 100 µL of chloroform was set as 100% for each strain. (G–J) show lytic development of bacteriophage P1 in the wild type (green circles) and dksA (blue squares) hosts at 37 °C. The phage burst size was calculated as plaque forming units per infective center (pfu/IC). Bacteria were cultured after infection in LB containing 10 mM EGTA—panel (G). Cells were diluted in LB and the experiment was carried out for a longer period of time (H). Bacteria from overnight cultures were used for infection (I). (J) Effect of DksA overproduction. P1vir development in the wild type strain harboring pJK537 plasmid is represented by a yellow line and dksA mutant harboring pJK537 by a red line. Blue line indicates the wild type strain and green line determines the dksA mutant, not harboring plasmids. For all panels: blue squares or columns represent the wild type cells and green circles or columns represent the dksA mutant. Presented results are mean values obtained from at least three independent experiments. Error bars represent SD values. Statistical significance was estimated with t-test; asterisk (*) marks p < 0.05 and(ns) stands for not significant.

