Figure 1.
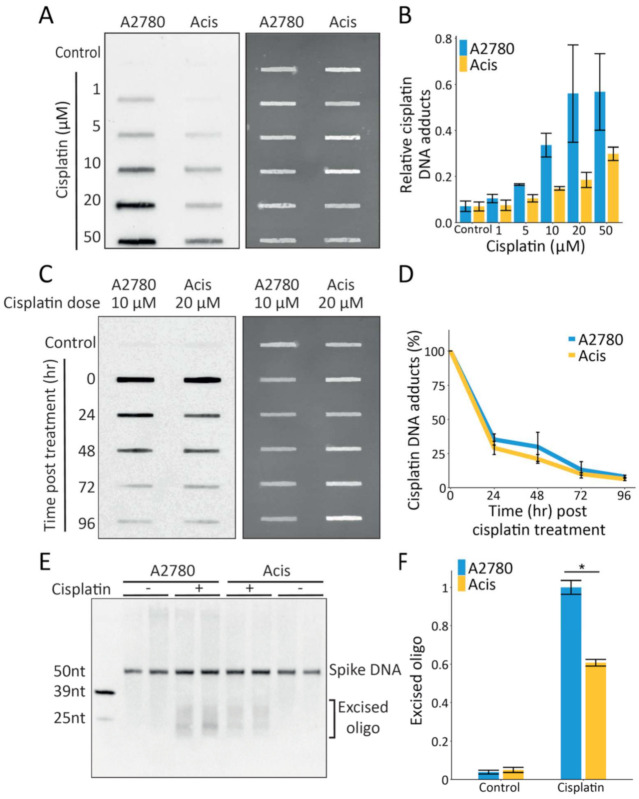
Lower cisplatin damage formation but similar repair kinetics in Acis compared to A2780 cells. (A) Representative immuno-slot blot (left panel) for cisplatin initial damage following increasing cisplatin doses treatment (1 µM–50 µM). Total nucleic acid amounts measured by SYBR-Gold staining (right panel). (B) Damage signal normalized to total nucleic acid amounts, showing cisplatin initial damage signal following increasing doses. Averages and error bars (SEM) are shown for data from three biological replicates. (C) Representative immuno-slot blot for cisplatin damage signal at different time points following cisplatin treatment (left panel). Total nucleic acid amounts measured by SYBR-Gold staining (right panel). (D) Damage signal normalized to total nucleic acid amounts, showing cisplatin repair kinetics of A2780 and Acis cell lines. Averages and error bars (SEM) are shown for data from two biological replicates. (E) Representative blot of excised oligos released during NER following 200 µM cisplatin treatment in A2780 and Acis cells. (F) Normalized excision products calculated by dividing excision product signal by 50 nt spike- in DNA amounts. Data are represented as mean ± SEM from three biological replicates. * p < 0.05 based on paired Student’s t-test.

