Figure 5.
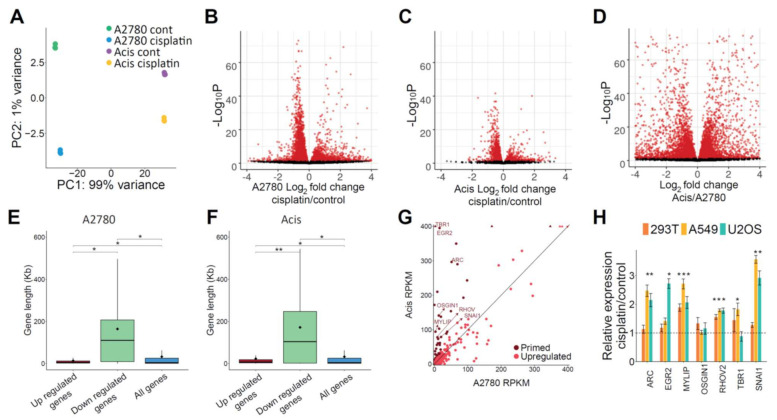
Gene expression analysis identifies cisplatin-responsive genes primed in Acis prior to treatment. (A) PCA plot of A2780 and Acis control and cisplatin-treated RNA-seq libraries. (B) Volcano plot for differentially expressed genes in A2780 control vs. cisplatin treated samples. (C) Volcano plot for differentially expressed genes in Acis control vs. cisplatin-treated samples. (D) Volcano plot for differentially expressed genes in A2780 control vs. Acis control. (E) Gene length distribution of differentially expressed genes in A2780. Gene length distribution of all annotated genes is shown for comparison. * p < 0.0001, based on Wilcoxon rank sum test. (F) Gene length distribution of differentially expressed genes in Acis. * p < 0.0001, ** p < 0.001 based on Wilcoxon rank sum test. (G) A2780 and Acis control RPKM levels of upregulated genes following cisplatin treatment in A2780 cells. Genes included in the primed genes list are colored in dark red. RPKM levels higher than figure limit are depicted using arrowheads. (H) Real-time quantitative PCR relative expression levels of candidate genes in 293T, A549, and U2OS cell lines following cisplatin treatment. Values represent averages of four biological replicates ± SEM. * p < 0.05, ** p < 0.01, *** p < 0.001 based on paired Student’s t-test.

