Figure 4.

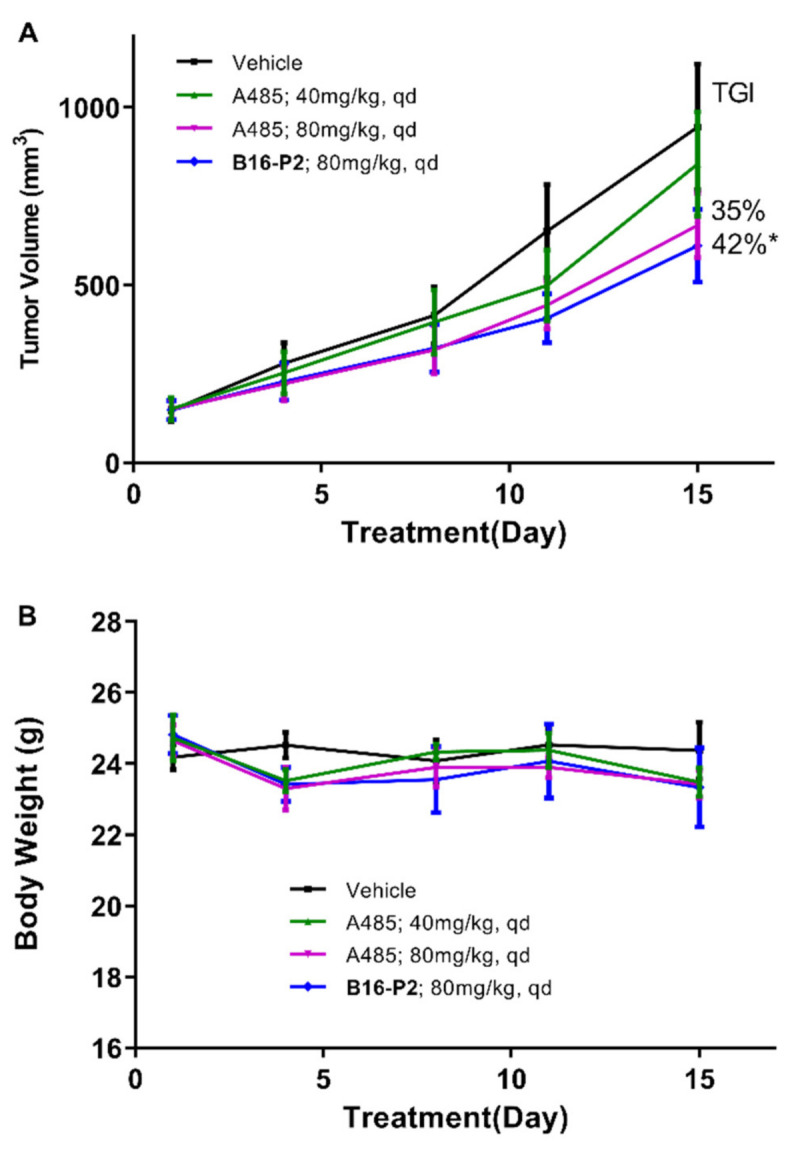
In vivo 22Rv1 xenograft model study of compound B16-P2 and A-485. (A) The tumor growth curve of four groups. (B) The body weights of mice over time (n = 6, * p < 0.05 versus control).

In vivo 22Rv1 xenograft model study of compound B16-P2 and A-485. (A) The tumor growth curve of four groups. (B) The body weights of mice over time (n = 6, * p < 0.05 versus control).