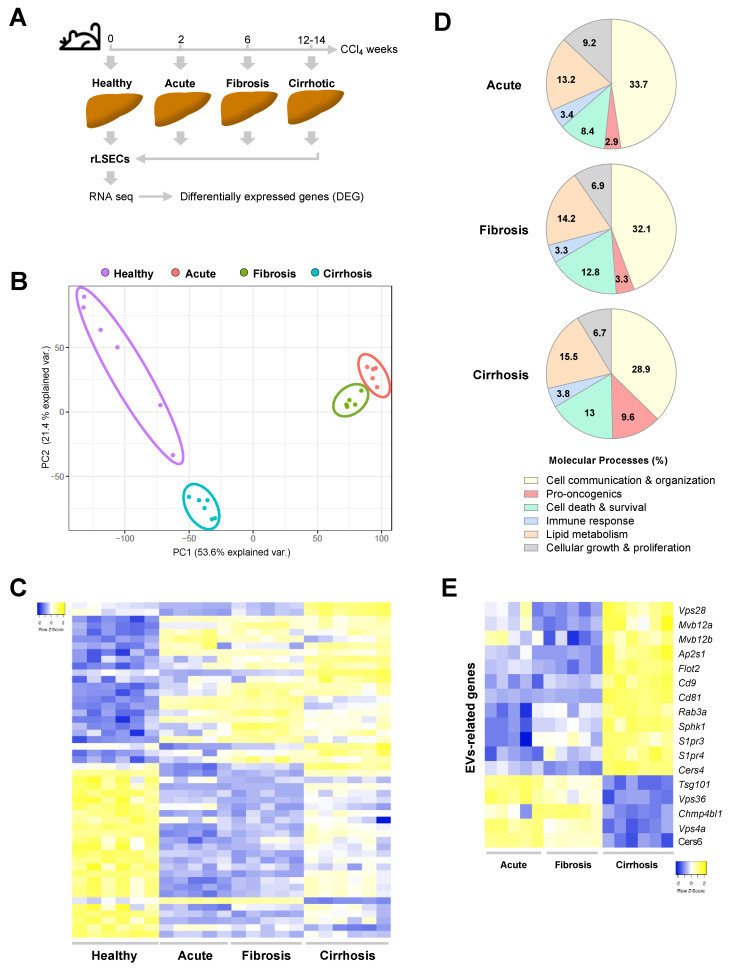
Figure 3.
LSECs transcriptome during the progression of CLD. (A) Schematic diagram of LSECs isolation and RNAseq during CLD progression. (B) Principal Component Analysis representation of LSECs isolated at different stages of liver disease. (C) Top 25 up- (yellow) and down-regulated (blue) LSECs genes during CLD progression. Deregulated genes have been ordered according to the fold-change in cirrhotic LSECs. (D) Molecular processes of LSECs deregulated genes in each stage of CLD analysed by Ingenuity Pathway Analysis. (E) Representative deregulated genes during CLD progression implicated in the biogenesis and exocytosis of extracellular microvesicles. n = 5–6 independent LSECs isolations per disease stage. Differences in RNAseq are considered significant when fold-change > 1.5 and p-value < 0.05.

