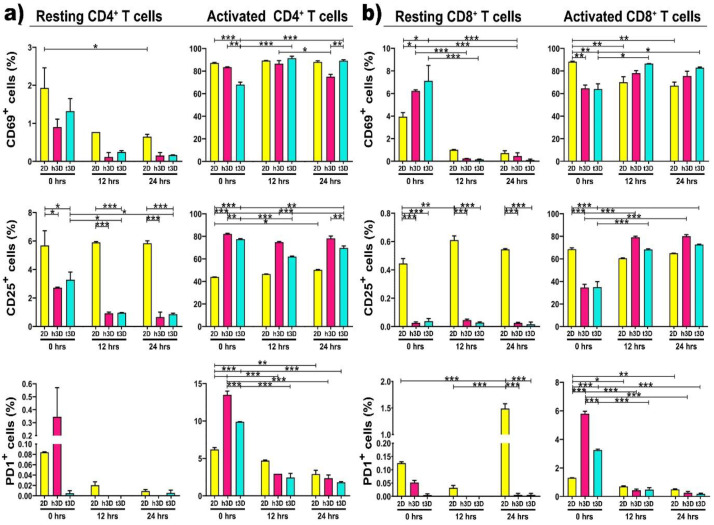
Figure 4.
Surface markers expression. Graphs represent the percentage of resting and activated CD4+ (a,b) CD8+ T cells expressing CD69 (upper panel), CD25 (middle panel) and PD1 (lower panel) surface markers. * p < 0.033, ** p < 0.002, *** p < 0.001 were considered statistically significant. n = 3 for each experimental group.

