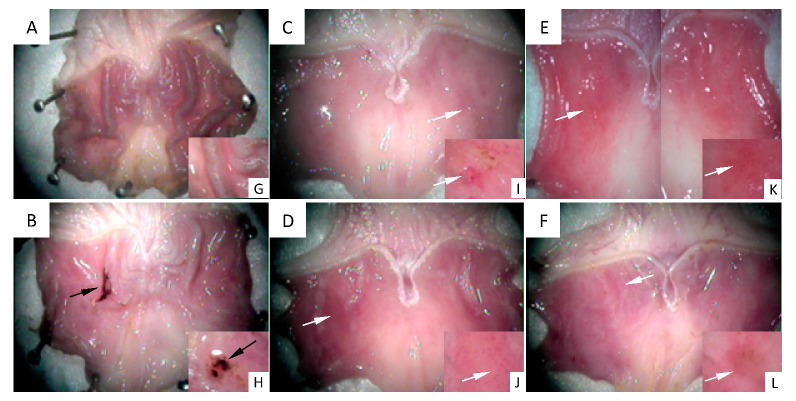
Figure 2.
Images of the stomachs’ inner surface are seen under a stereoscopic magnifying glass. (A) control group ((G) details of gastric roughness); (B) 48/80 group ((H) details of gastric ulcer); (C) DhL + 48/80 group; (D) Xt + 48/80 group; (E) But + 48/80 group; (F) Crgl + 48/80 group ((I–L) details of mild hyperemia). Black arrows: gastric ulcer. White arrows: mild hyperemia.

