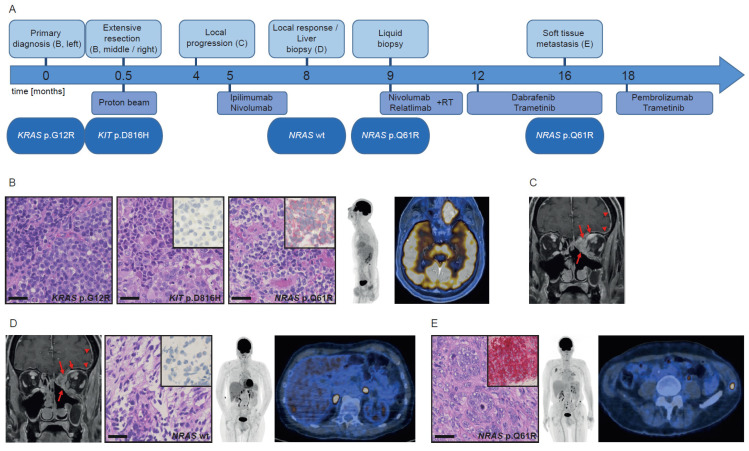
Figure 1.
Course of disease, treatment, and morpho-molecular workup of patient 1. (A) Timeline. (B) Histology of the primary tumor, including NRAS Q61R immunohistochemistry (inserts); left: KRAS mutant region, middle: KIT mutant region, right: NRAS mutant region; PET MIP display and fused PET/CT image at primary diagnosis. (C) T1-weighted contrast-enhanced and fat-suppressed MR image at local progression (long arrows: sinonasal tumor mass, short arrows: intraorbital extraconal tumor mass, arrowheads: dural enhancement. (D) MR image at local regression (arrows/arrowheads: see above), histology of the liver biopsy, including NRAS Q61R immunohistochemistry (insert); PET MIP display and fused PET/CT image before liver biopsy. (E) Histology of the soft tissue metastasis, including NRAS Q61R immunohistochemistry (insert); PET MIP display and fused PET/CT image at progression under kinase inhibitors. Scale bar: 40 µm. wt: wild type.

