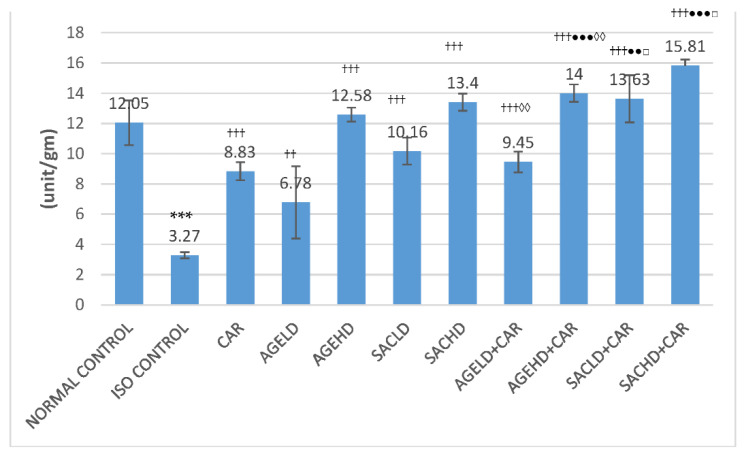
Figure 3.
Effect on LDH activities in heart tissue homogenate. The data are presented as mean ± SEM; *** p < 0.001 compared with normal control; †† p < 0.01, ††† p < 0.001 in comparison with ISO control; ●● p < 0.01, ●●● p < 0.001 in comparison with carvedilol; ◊◊ p < 0.01 when compared with respective AGE dose; □ p < 0.05 when compared with respective SAC dose.

