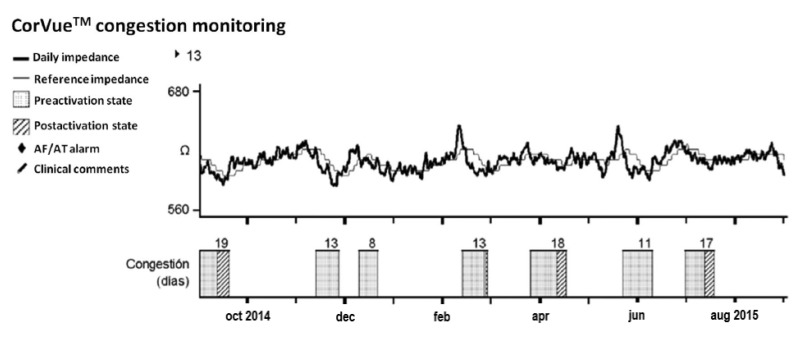
Figure 3.
Trend of the CorVueTM congestion monitoring. This example illustrates the potentially misleading information displayed on the device follow-up report. The graphic shows seven episodes of congestion with different days of duration (pre-activation state: checked bars) that generated alarms (post-activation state: oblique lined bars) for four of these episodes without an associated clinical event (false positive). Reproduced with permission from Palfy et al. (Pacing Clin Electrophysiol, 2018) [14].

