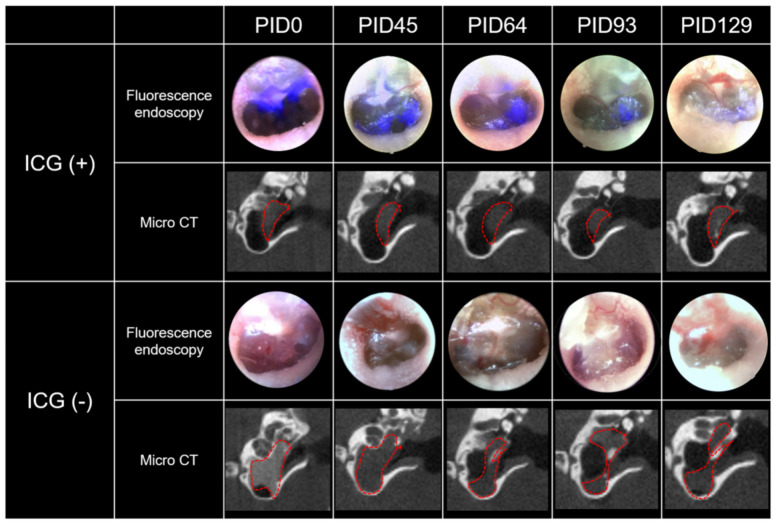
Figure 3.
Real-time fluorescence endoscopy of ICG and micro CT in the same ears. The ICG (+) group was injected with 5 mg/mL of ICG in cross-linked HA, whereas the ICG (−) group was injected with a control dye (iodinated dye with no fluorescence) in cross-linked HA. The fluorescence was very strong on PID0 in the ICG (+) group. This fluorescence was clearly visible up to PID64 to 93 and became very faint on PID129. Meanwhile, no fluorescence was observed in the ICG (−) group. This pattern of fluorescence was independent of the vehicle because a large amount of vehicle was always visible in the middle ear according to micro CT observations.

