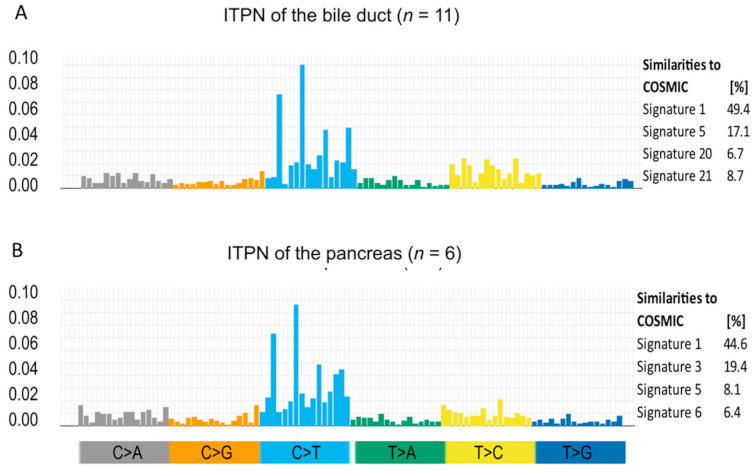
Figure 4.

Mutational signature pattern analysis. Mutational signature patterns (left side) of ITPN of the bile duct (A) and of the pancreas (B), as well as their overlap with published COSMIC signatures (right side), show a resemblance to signature 1, the most common signature in all cancers, including pancreas and liver. Substitutions are displayed in the trinucleotide context and plotted on the x-axis, while fractions are shown on the y-axis. Each class of substitution is displayed by a different color.
