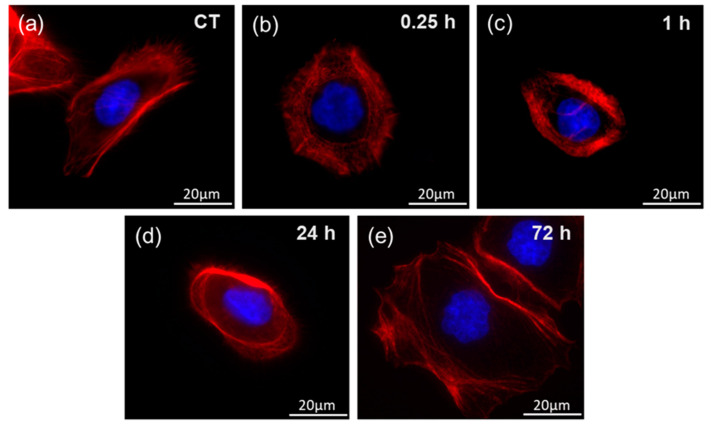
Figure 7.
Representative fluorescent images of F-actin organization in the gastric adenocarcinoma cells during exposure to heat-treated H. pylori cells and corresponding Young’s modulus measurements at set time points: (a) control cells 0 h; (b) 0.25 h of incubation; (c) 1 h of incubation; (d) 24 h of incubation; (e) 72 h of incubation.

