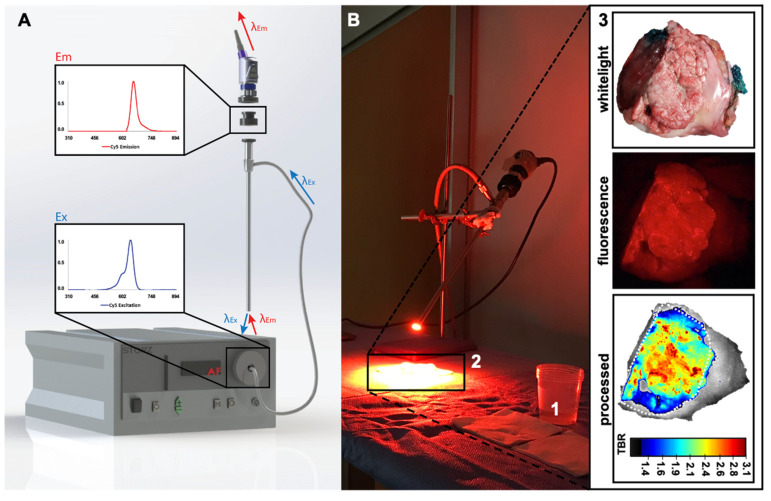
Figure 2.
Imaging set-up and image processing. (A) The dedicated Cy5 imaging system consisting out of a Karl Storz light-source (I), fluorescence camera (II), Cy5 clip-on filter (III) and scope (IV). Inserts show the fluorescence excitation (bottom; λex 650 nm) and emission (top; λem 670 nm) of the far-red dye Cy5. (B) Tracer incubation (1) and camera set-up for imaging of the tissue sample (2) of a representative tissue sample (3) showing the location of the tumor (dotted line) using white light (top) and standard fluorescence imaging (center) and after image processing (bottom; the scale bar represents the tumor-to-background ratio (TBR) corresponding to the fluorescence signal intensity).

