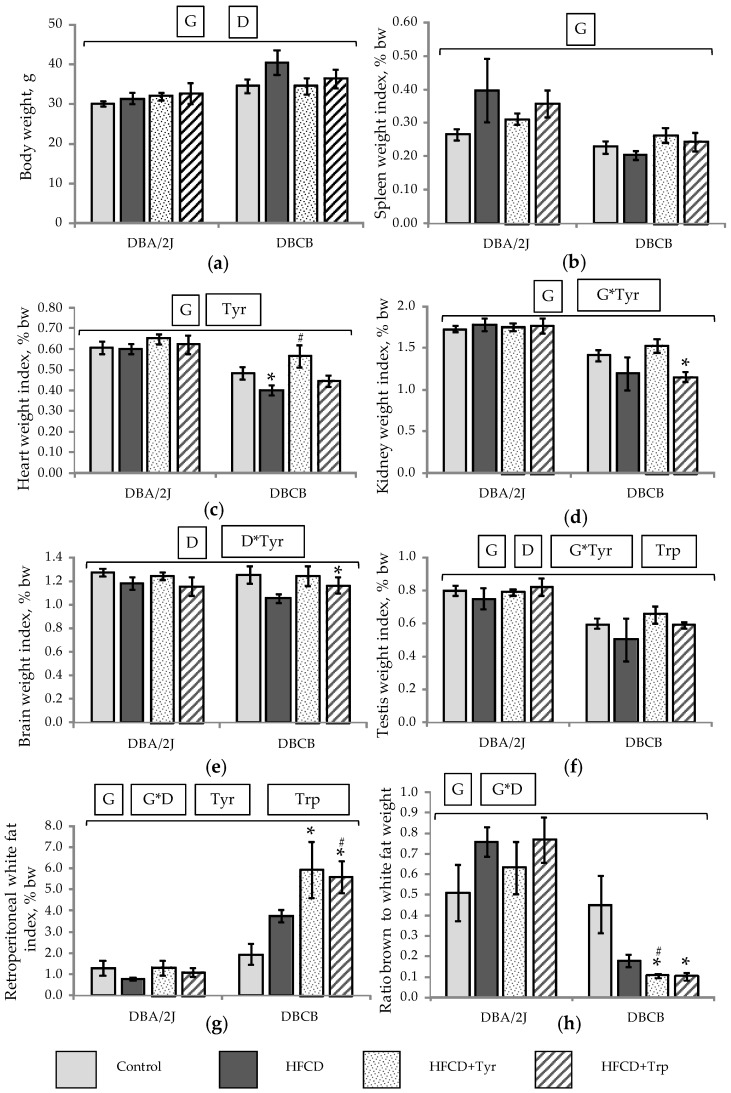
Figure 2.
Integral indicators (M ± S.E.M.) of mice at the end of the experiment on the 66th day: (a) Bw; relative weight index of organs and tissues: (b) Spleen, (c) Heart, (d) Kidneys, (e) Brain, (f) Gonads, (g) Retroperitoneal white fat; (h) The ratio of the weight of interscapular brown fat to the retroperitoneal white fat. * The difference with the control group is significant; # The difference with the HFCD-only fed group is significant, p < 0.05, Mann–Whitney U-test. Horizontal bracket—distribution is non-uniform (p < 0.05, ANOVA) by the factors genotype (G), diet (D), tyrosine (Tyr), tryptophan, (Trp) and their combinations for the covered range of samples. The number of animals in groups—see Table 1.

