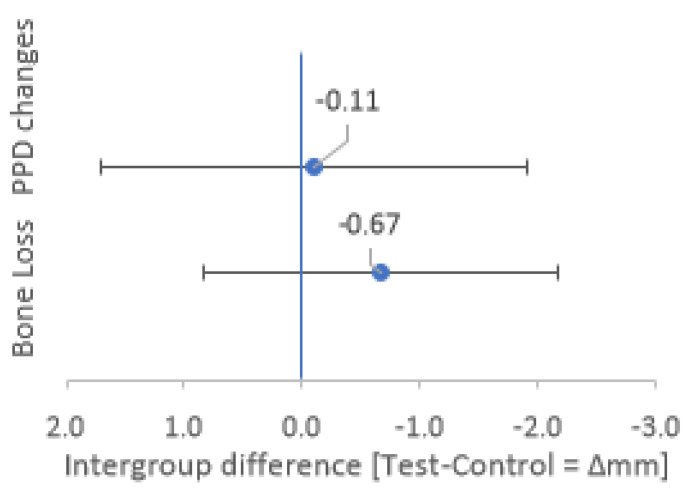
Figure 6.
Intergroup differences for Bone Loss and PPD changes after 1 year. Mean intergroup differences (Test–Control) for Bone Loss and PPD changes after 1 year are represented by blue dots. The confidence intervals of 95% (CI95) for the intergroup differences are represented by the lower and upper whiskers.

