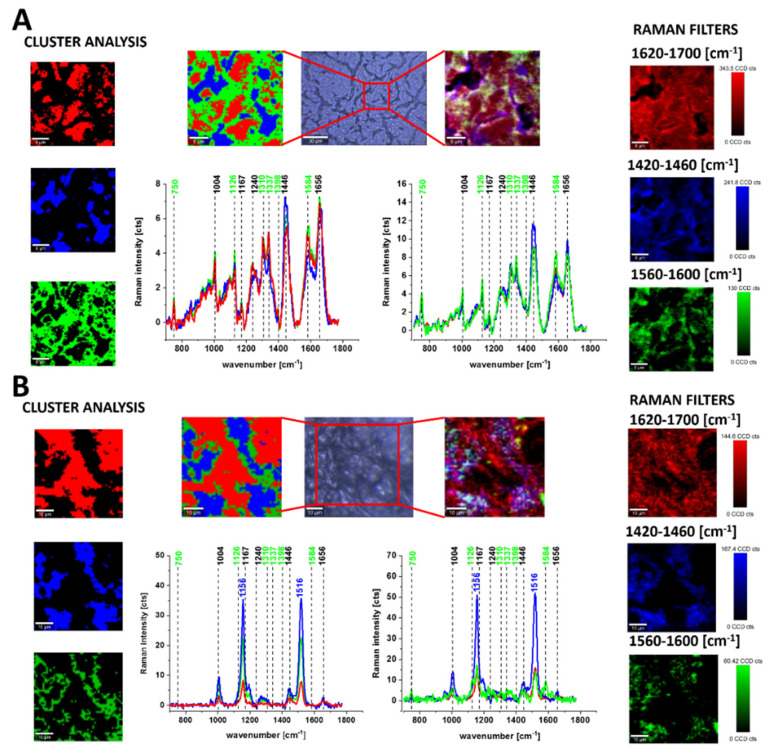
Figure 2.
Microscopy image, Raman images of distribution of proteins (red color), lipids (blue color) and cytochrome c (green) by using Cluster Analysis and Raman filters for brain tumor, grade IV medulloblastoma (40 × 40 μm, resolution 0.5 μm, integration time 1.0 s, the average Raman spectra of lipids ─ blue, proteins ─ red, cytochrome ─ green at 532 nm) (A). Microscopy image, Raman images of distribution of proteins (red color), lipids and carotenoids (blue color) and cytochrome c (green) by using Cluster Analysis and Raman filters for breast cancer, grade III ductal cancer (40 × 40 μm, resolution 0.5 μm, integration time 1.0 s, the average Raman spectra of lipids and carotenoids ─ blue, proteins ─ red, cytochrome ─ green at 532 nm) (B).

