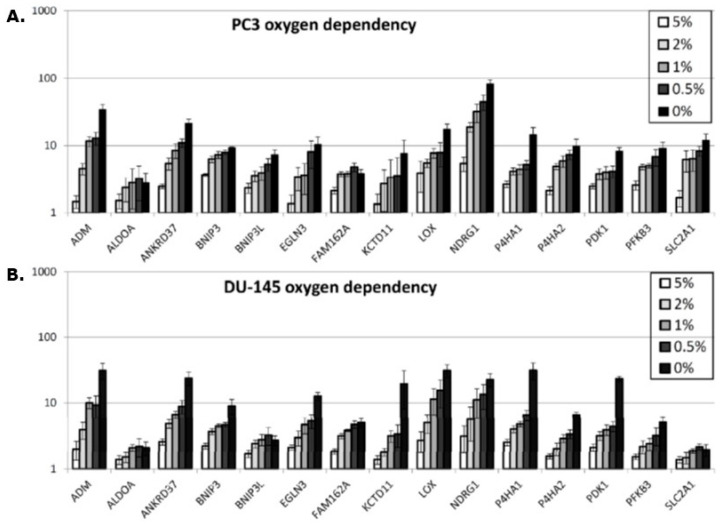
Figure 3.
The increased degree of gene expression in vitro under different oxygen concentrations compared to that found under 21% oxygen. Results show means (± 1 S.E.) for n = 3 measurements in PC3 (A) or DU-145 (B) cells. Cells were exposed to the different oxygen concentrations as indicated for 24 h. A greater degree of up-regulation with decreasing oxygen concentration is seen for almost every gene in both cell lines.

