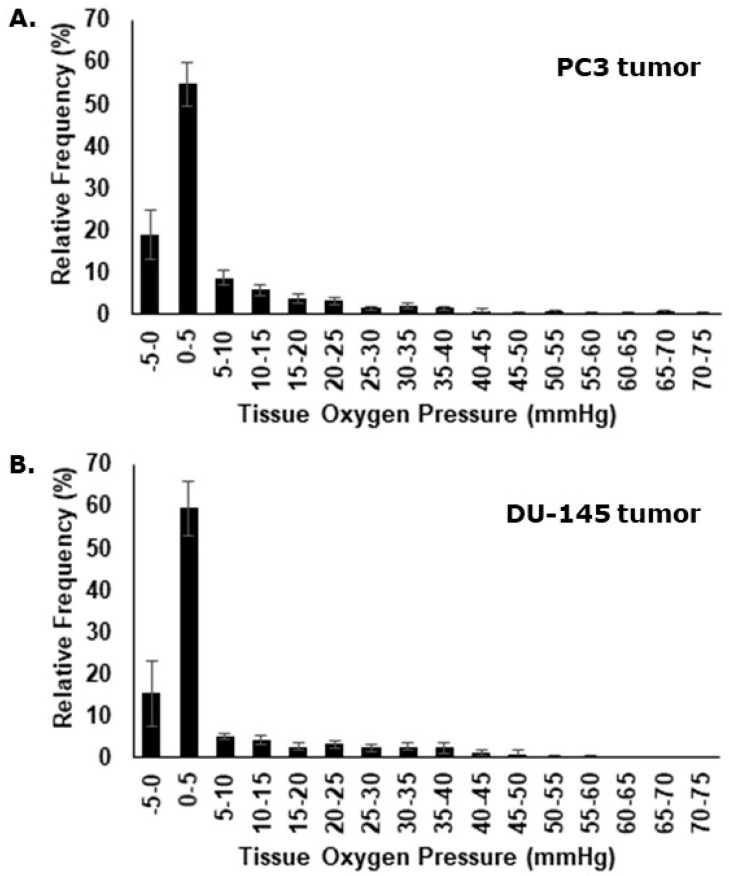
Figure 4.
Representative histograms showing the oxygen partial pressure (pO2) profiles obtained with the Eppendorf oxygen electrode in PC3 (A) or DU-145 (B) xenografts. Results show the means (±1 S.E.) of the relative frequency of the various pO2 values measured in individual flank tumors from eight (PC3) or 10 (DU-145) tumor-bearing mice. Both tumor types were very hypoxic.

