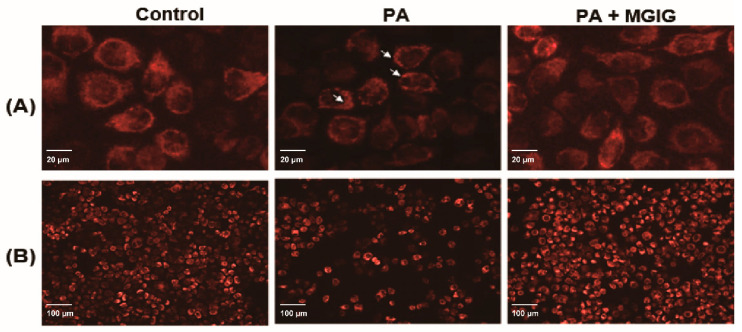
Figure 3.
The effect of palmitic acid (PA) and magnesium isoglycyrrhizinate (MGIG) on the morphological structures of the endoplasmic reticulum and mitochondria of HepaRG cells. (A) Typical image of the endoplasmic reticulum stained with the ER tracker (red), the scale bar is 20 μm. (B) Typical image of mitochondria stained with TMRM (red), the scale bar is 100 μm. The control group was untreated cells; the PA group was cells administered 0.2 mM PA for 24 h; the PA + MGIG group was cells administered 0.2 mM PA plus 0.25 mM MGIG for 24 h. n = 3 in each group. Arrow: the fragmented ice floe structures of the endoplasmic reticulum membrane.

