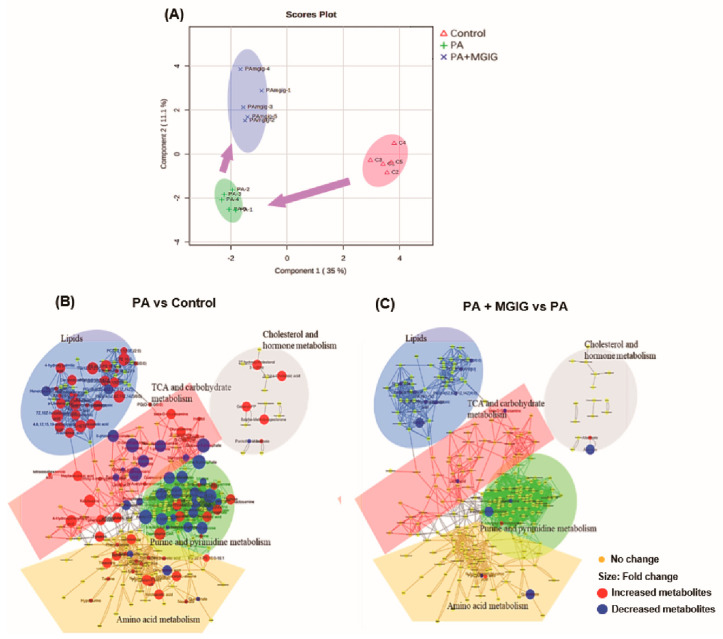
Figure 4.
The regulatory effect of magnesium isoglycyrrhizinate (MGIG) on palmitic acid (PA)-induced metabolic reprogramming of HepaRG cells. (A) PLS-DA score plot for multivariate analysis of the three test groups; (B) Visual plot for all identified endogenous metabolites of the Control group and the PA group created using Cytoscape; (C) Visual plot for the PA group and the PA + MGIG group. The Control group was untreated cells; the PA group was cells administered 0.2 mM PA for 24 h; and the PA + MGIG group was cells administered 0.2 mM PA plus 0.25 mM MGIG for 24 h. n = 5 in each group.

