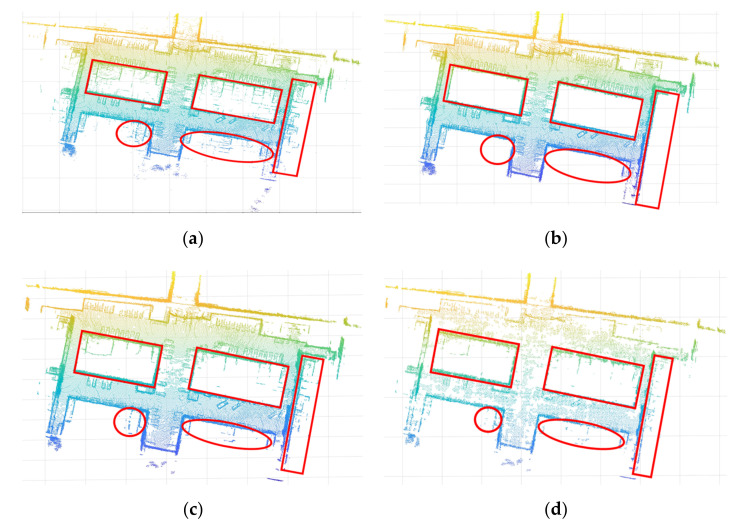
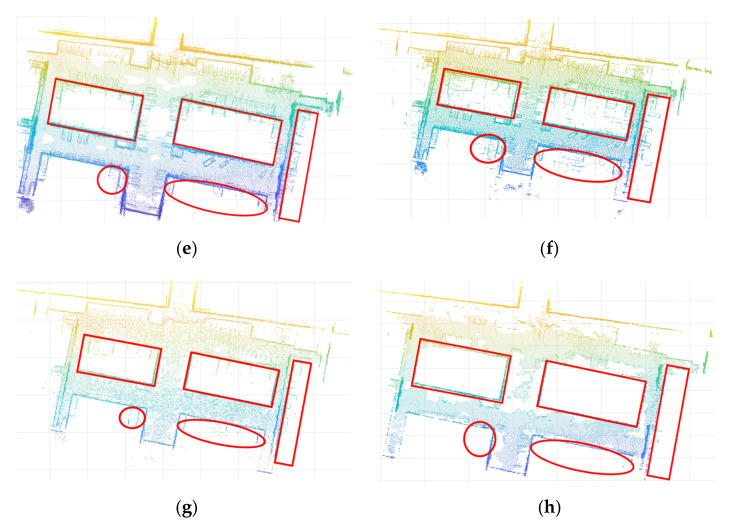
Figure 9.
The results of several filtering processes, where the main noise is marked within the red shape: (a) the initial data collected; (b) the data processed by artificial filtering on the initial data; (c) the data processed by the statistical outlier removal (SOR) filter; (d) the data processed by the SOR filter on the basis of voxel grid filter processing (the voxel grid statistical outlier removal (VGSOR) filter); (e) the data processed by the radius outlier removal (ROR) filter; (f) the data processed by the Gaussian filter; (g) the data processed by the difference of normals (DON) method; and (h) the data processed by the GPCA method.


