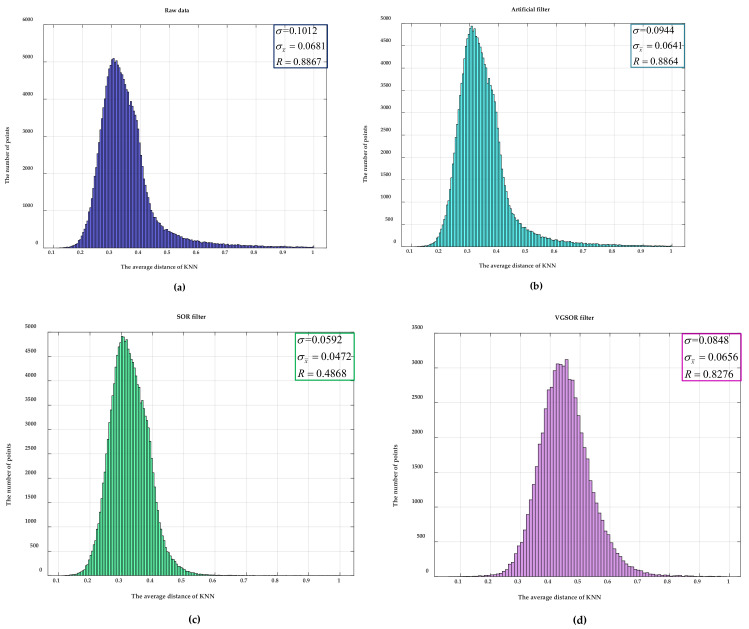
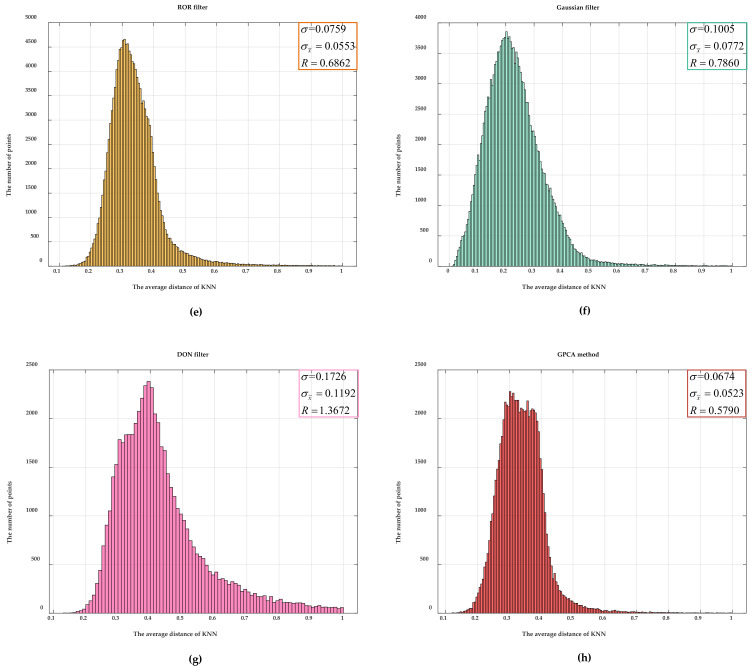
Figure 10.
A statistical graph of the average distance of KNN: this average distance is used to evaluate the degree of data dispersion. We calculated three evaluation parameters for the initial and several filtered data. The standard deviation is expressed as . The mean variation is expressed as . The range is expressed as . (a) A statistical graph of the raw data, (b) a statistical graph of the data filtered by the artificial filter, (c) a statistical graph of the data filtered by the SOR filter, (d) a statistical graph of the data filtered by the VGSOR filter, (e) a statistical graph of the data filtered by the ROR filter, (f) a statistical graph of the data filtered by the Gaussian filter, (g) a statistical graph of the data filtered by the DON filter, and (h) a statistical graph of the data filtered by the GPCA method are presented.


