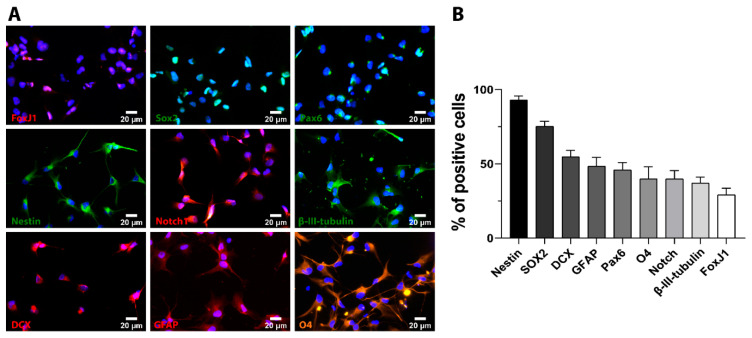
Figure 1.
In vitro characterization of cultured iPSC-NSC. (A). Representative immunofluorescence staining images for the indicated cell markers. DAPI (blue) employed for nuclei counterstaining. Scale bar = 20 µm. (B). Quantitative analysis of the percentage of positive cells for each cell marker. Data expressed as mean ± S.E.M. from three independent cell culture experiments.

