Figure 3.
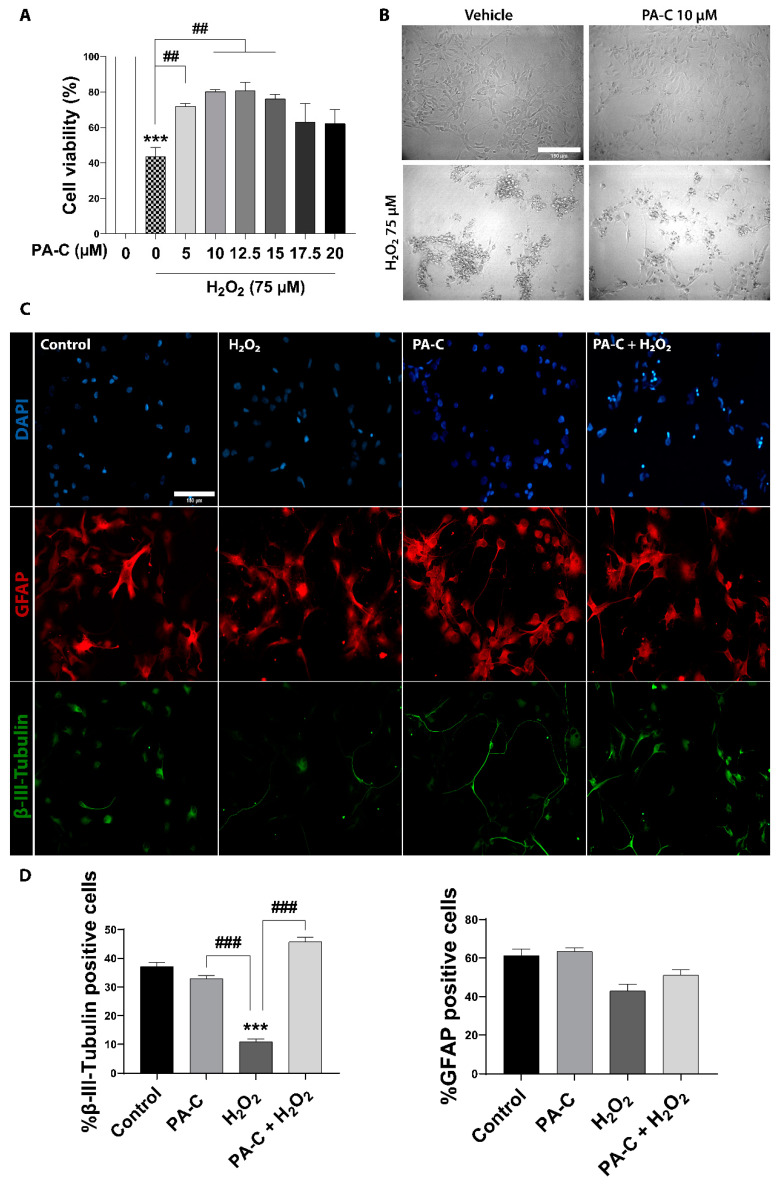
Neuroprotective effect of PA-C pre-treatment following peroxide-induced cytotoxicity in iPSC-NSC. (A). Effect of PA-C pre-treatment (5, 10, 12.5, 15, 17.5, and 20 µM) on iPSC-NSC viability following a 24 h incubation with 75 µM H2O2. MTS viability values represented as a percentage of vehicle-treated control cells. Data expressed as mean ± S.E.M. of three independent experiments determined by one-way ANOVA multiple comparison tests (*** p < 0.0001 vs. Control; ## p < 0.01 as indicated). (B). Representative bright-field images of iPSC-NSC morphology after PA-C pre-treatment and H2O2 treatment (scale bar = 150 µm). (C). Representative immunofluorescence staining of β-III-Tubulin (green), GFAP (red), and DAPI (blue) of iPSC-NSC pre-treated for 30 min with 10 µM PA-C and then incubated with 75 µM H2O2 for 24 h. Scale bar = 150 µm. (D). Quantitative analysis of the ratio of β-III-Tubulin cells and GFAP cells shown as a percentage of total DAPI from immunostaining. Data expressed as mean ± S.E.M. from three independent experiments as determined by one-way ANOVA with Tukey’s multiple comparison test (*** p < 0.001 vs. Control; ### p < 0.001 as indicated).

