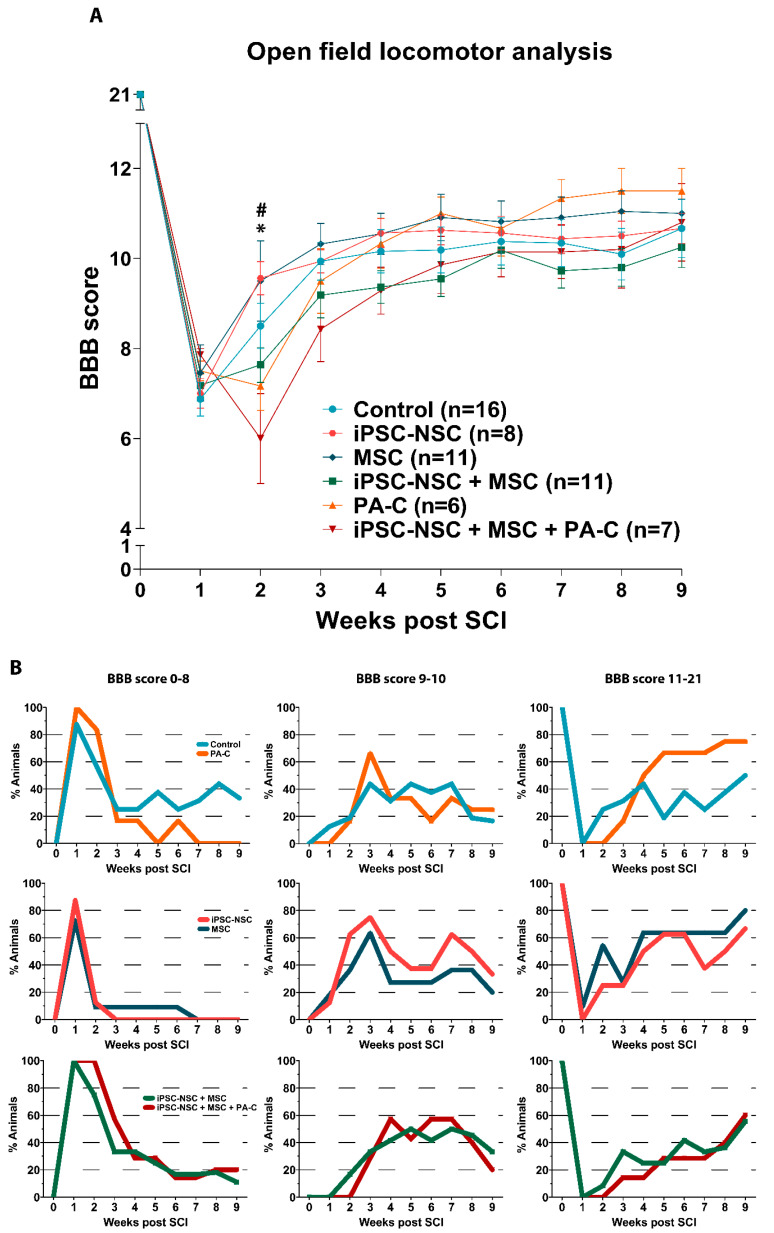
Figure 5.
Locomotor recovery after SCI following single treatments and combination therapy. (A). Time course locomotor evaluation by open-field BBB scale over nine weeks post-SCI. (B). BBB locomotor evaluation subdivisions (0–8, 9–10, and 11–21) showing the percentage of animals in each score range. Treatments compared at all post-injury time points. Data expressed as mean ± S.E.M. (control n = 16; iPSC-NSC n = 8; MSC n = 11; iPSC-NSC + MSC n = 11; PA-C n = 6; iPSC-NSC + MSC + PA-C n = 7) determined by two-way mixed model ANOVA with Tukey’s multiple comparison test (* p < 0.05 iPSC-NSC vs. PA-C; # p < 0.01 iPSC-NSC vs. iNSC + MSC).

