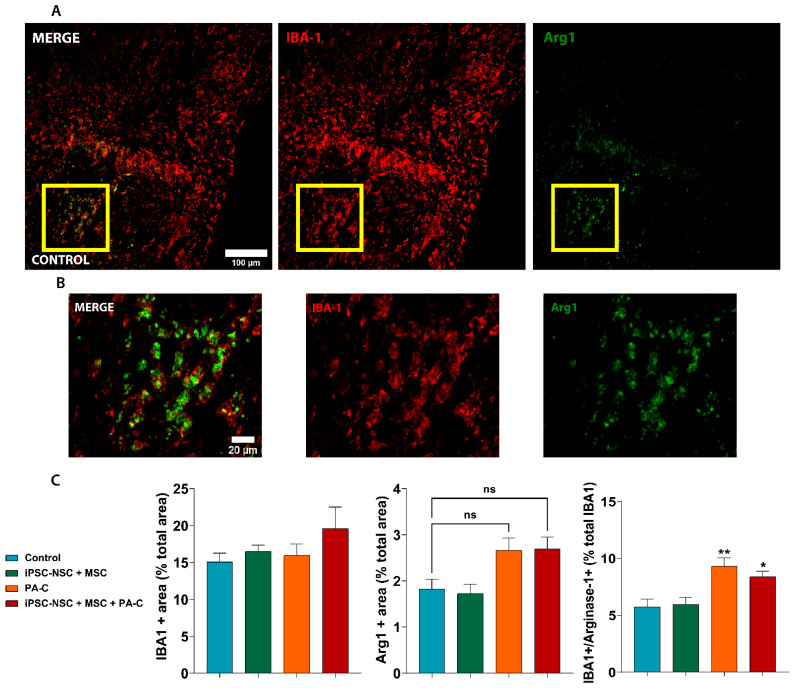
Figure 8.
PA-C and PA-C combined with iPSC-NSC + MSC transplantation prompt microglial polarization towards an anti-inflammatory profile. (A). Representative immunostaining images of IBA1 (microglia marker; red) and Arg1 (anti-inflammatory marker; green) (scale bar = 100 µm). (B). Magnified images of the indicated area in A with a yellow square for IBA1 and Arg1 staining (scale bar = 20 µm) (C). Quantification of total microglia, positive for IBA1 (left panel) and the total number of cells positive for Arg1 (central panel), which are represented as the percentage of positive cells of the tissue area analyzed; Right panel represents the percentage of activated microglia, co-expressing IBA1 and Arg1, represented as a percentage of the total microglia (positive for IBA1). Quantitative data expressed as mean ± S.E.M determined by one-way ANOVA with Tukey’s multiple comparison test (n = 3). * p < 0.05, ** p < 0.01 vs. control; ns (non-significant) as indicated.

