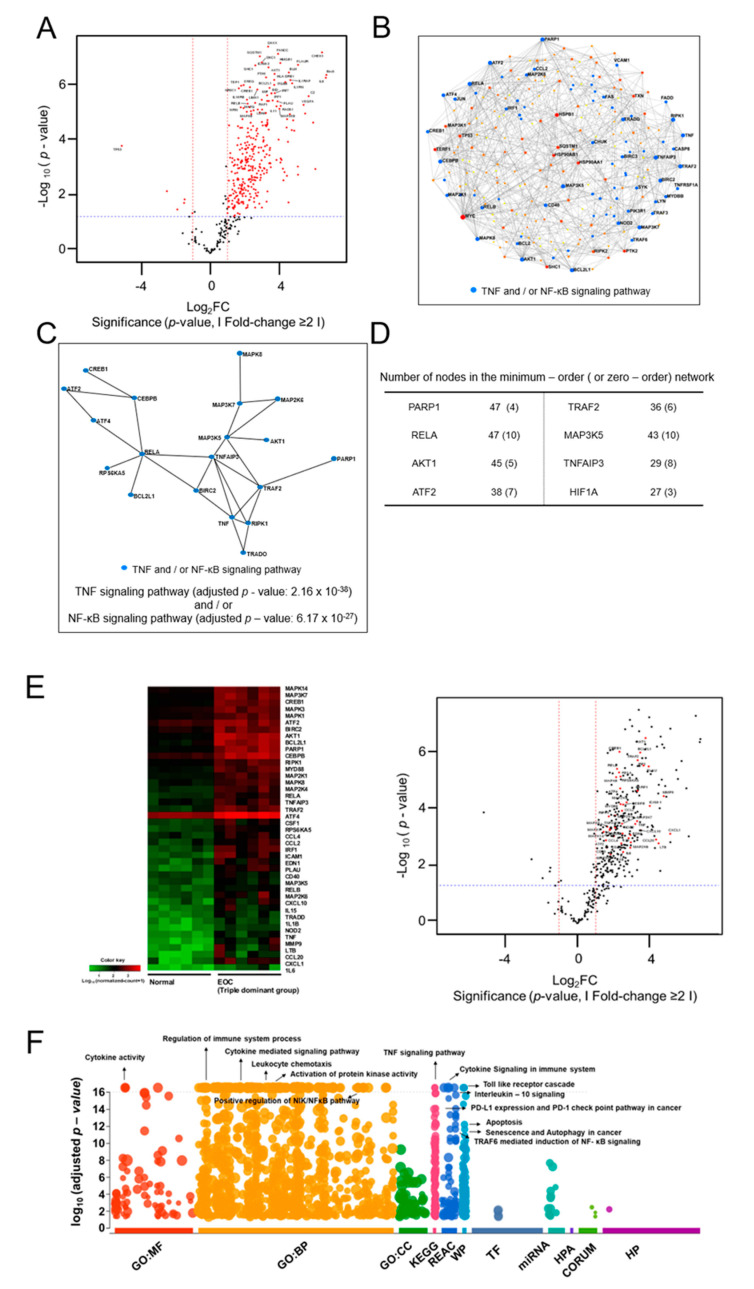
Figure 4.
Analysis of differentially expressed genes (DEGs) in the triple dominant EOC group as compared to gene expression in normal ovarian epithelial tissues. Analysis of differentially expressed genes (DEGs) in the triple dominant EOC group compared with gene expression in normal ovarian epithelial tissues. (A) Volcano plot shows the upregulated DEGs in the triple dominant EOC group compared with gene expression in normal ovarian epithelial tissues. (B) Minimum-order and (C) zero-order protein-protein interaction (PPI) network was constructed with 167 upregulated DEGs using NetworkAnalyst (https://www.networkanalyst.ca/, accessed on 15 December 2020) (D) Genes with a higher number of PPI interactions are listed. (E) Most significantly upregulated pathways identified in the PPI networks are shown using Heatmap and volcano plot. (F) g:Profiler (https://biit.cs.ut.ee/gprofiler/, accessed on 15 December 2020) was used to dissect molecular pathways of 167 upregulated DEGs in the triple dominant EOC group compared with gene expression in normal ovarian epithelial tissues with the following categories: [GO:MF—molecular function; GO:BP—biologic process; GO:CC—cellular component; KEGG—Kyoto Encyclopedia of Genes and Genomes; REAC—reactome; WP—Wikipathways; TF—TRANSFAC; miRNA—miRTarBase; HPA—human protein atlas; CORUM—CORUM protein complexes; HP—human phenotype ontology].

