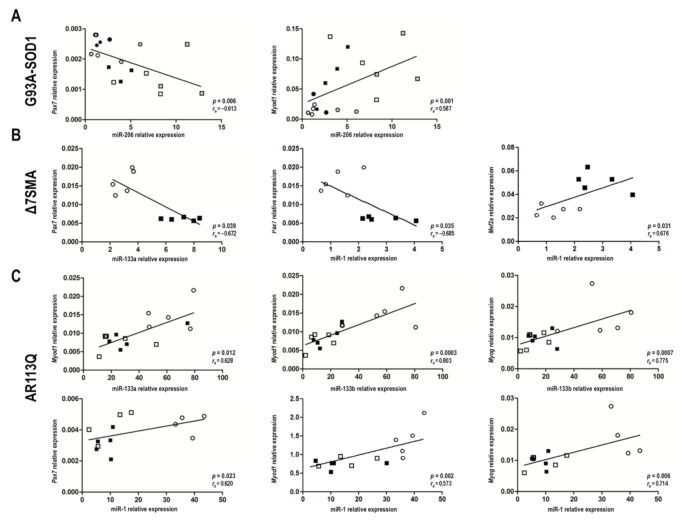
Figure 5.
MyomiR/mRNA correlation analysis in G93A-SOD1, Δ7SMA, and AR113Q during disease progression. Negative and positive correlations (p < 0.05) estimated by Spearman’s correlation test between myomiR and mRNA levels of Pax7, Myod1, Myog, and Mef2a in muscle tissue of: (A) G93A-SOD1 at weeks 7 (●), 8 (○), 10 (●), 12 (□), 15 (■), and 18 (■); (B) Δ7SMA at day 2 (○) and 10 (■); (C) AR113Q at weeks 8 (○), 14 (□), and 40 (■).

