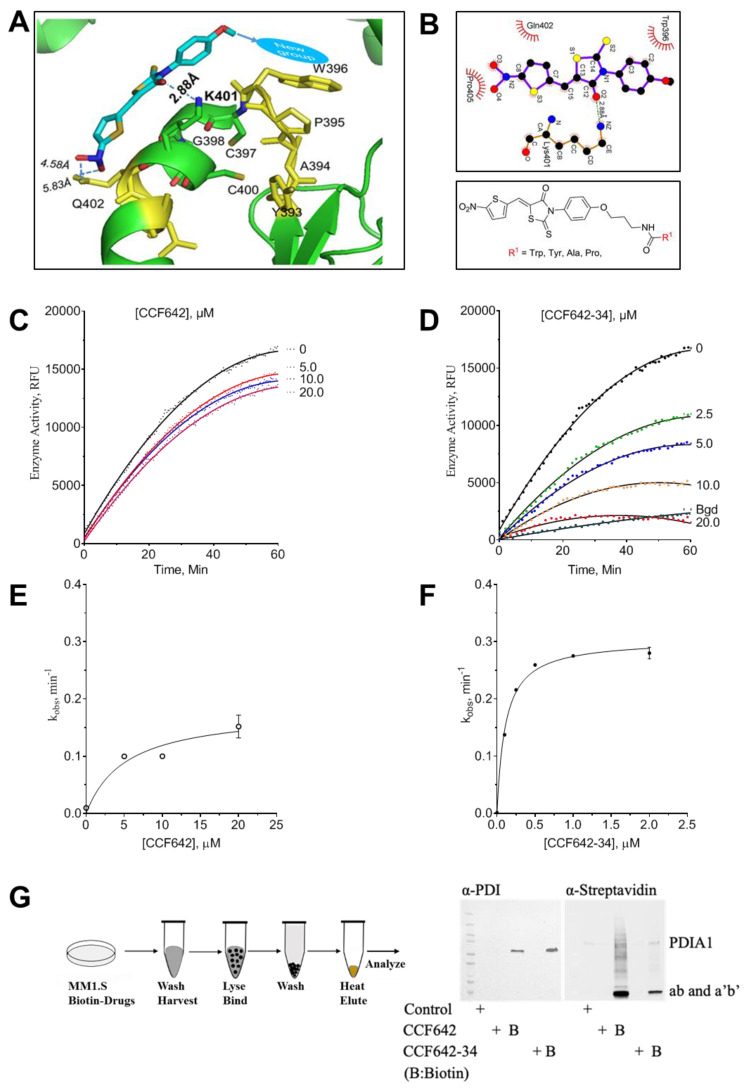
Figure 2.
Model-based design improves potency and selectivity of protein disulfide isomerase A1 (PDIA1) inhibitors. (A) Ribbon diagram of CCF642-34 docked onto PDIA1. (B) Two-dimensional structure of modified CCF642 pharmacophore, where R represents amino acids tryptophan, tyrosine, phenylalanine, histidine, proline, or alanine. (C) PDIA1/PH4B activity assay was performed in the absence or presence of CCF642 or (D) CCF642-34. In time-dependent inhibition of di-E-GSSG, reduction was monitored for 1 h by the increase in fluorescence, and the relative fluorescence unit was plotted as a function of time. (E,F) The observed rate constant for inhibition, kobs, at each concentration determined from the slope of kinetic data presented in panel (C,D). The kobs values are re-plotted against inhibitor concentration and fitted to a hyperbolic equation, kobs = k2[I]/(Ki + [I]), to obtain values for Ki and k2 in GraphPad Prism v8.0.2.The concentration of drug is indicated on each curve, for (E) 642 and (F) CCF642-34. (G) Target validation. Multiple myeloma cells (MM1.S) were treated with vehicle (DMSO) or B-CCF642-34 for 3 h and lysates were separated on SDS-PAGE gel followed by visualization by either anti-PDIA1 antibody or HRP-conjugated streptavidin. The bands’ identities are as labeled.

