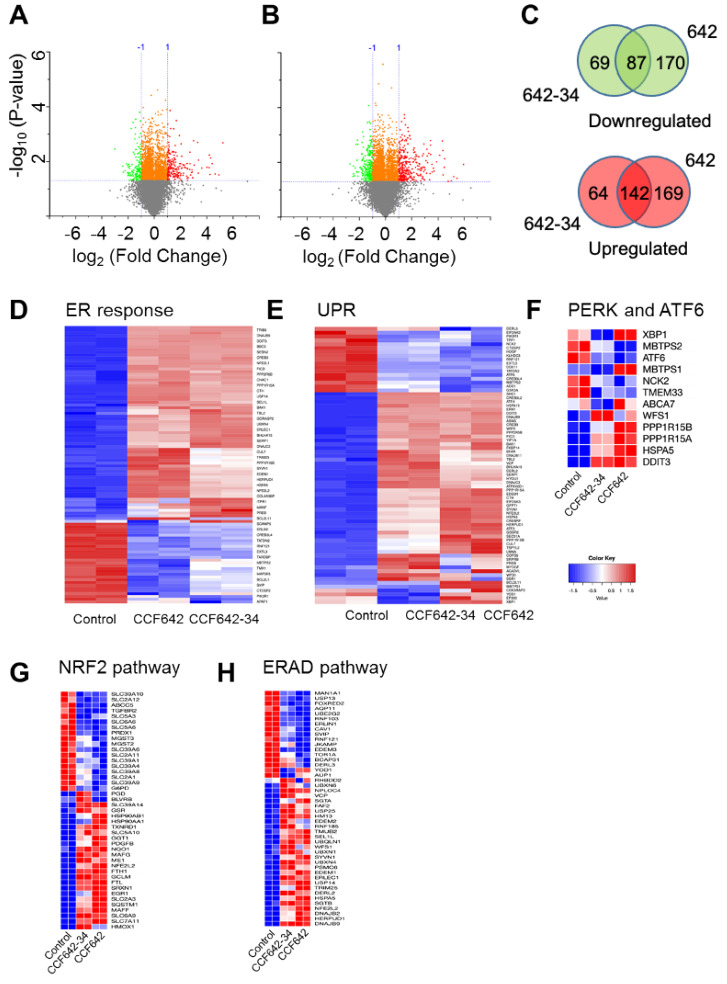
Figure 5.
CCF642-34 is selective for PDIA1 inhibition-induced ER stress response pathway. MM1.S cells were treated with 3 µM of either CCF642 or CCF642-34 for 6 h, and gene expression analysis was performed by RNA sequencing. (A,B) Volcano plots showing CCF642-34 and CCF642 compared to DMSO control. The criteria for differential expression were at least a 2-fold change with p value less than 0.05. The analysis was performed in Originlab, Version 2019b (OriginLab Corporation, Northampton, MA, USA). (C) Differentially upregulated (red) and downregulated (green) genes between CCF642-34 and CCF642 were compared in Venn diagrams. The diagram was generated using a web-based server, http://bioinformatics.psb.ugent.be/webtools/Venn/ (accessed on 3 March 2020). (D,E) Hierarchical clusterings with heat map of MM1.S cells treated with vehicle CCF642-34 or CCF642 are shown for response to endoplasmic reticulum stress and unfolded protein response gene sets. (F–H) Heat maps of PERK and ATF6 target genes, Nrf2, and ER-associated degradation (ERAD) pathways are compared between control and inhibitor-treated MM1.S cells. Data analysis was performed using a web-based server http://bioinformatics.sdstate.edu/idep/ and https://software.broadinstitute.org/morpheus/ (accessed on 5 February 2021).

