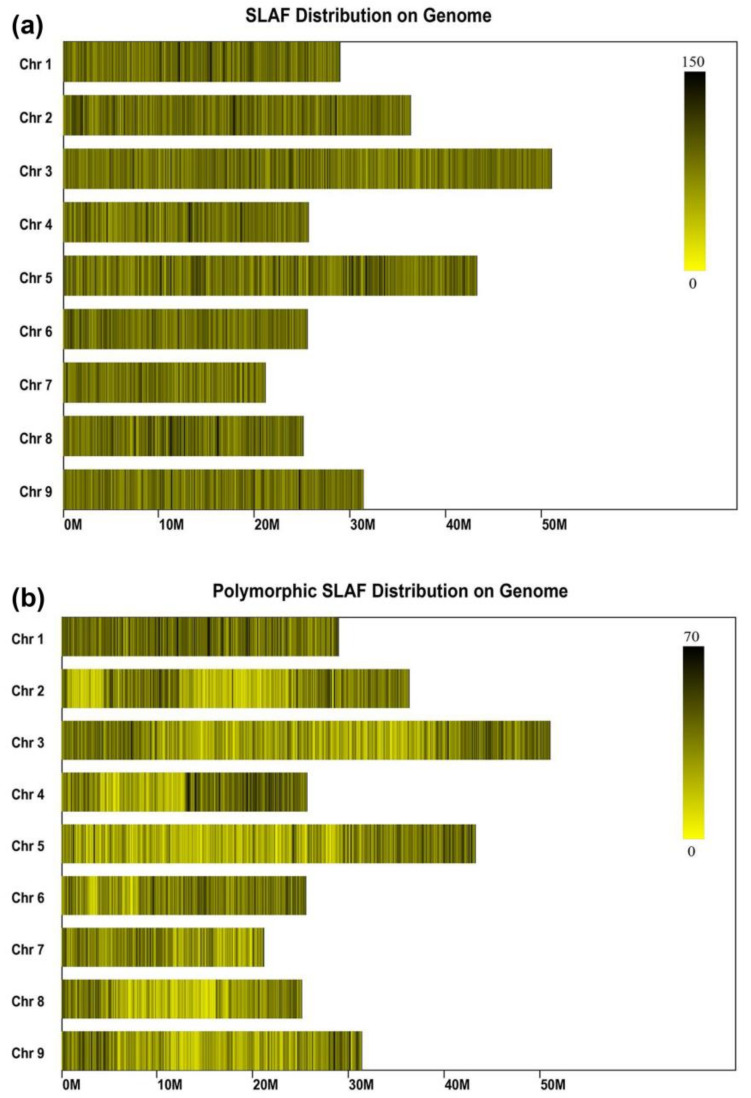
Figure 4.
SLAF sequencing and genotyping. (a) The distribution of all obtained the SLAF tags on nine citrus chromosomes. (b) The distribution of all the polymorphic SLAF tags on nine citrus chromosomes. The x-axis represents the location on chromosomes, the y-axis represents the nine chromosomes, the x-axis represents the length of chromosome. When the color is darker, the SLAF tag number is greater.

