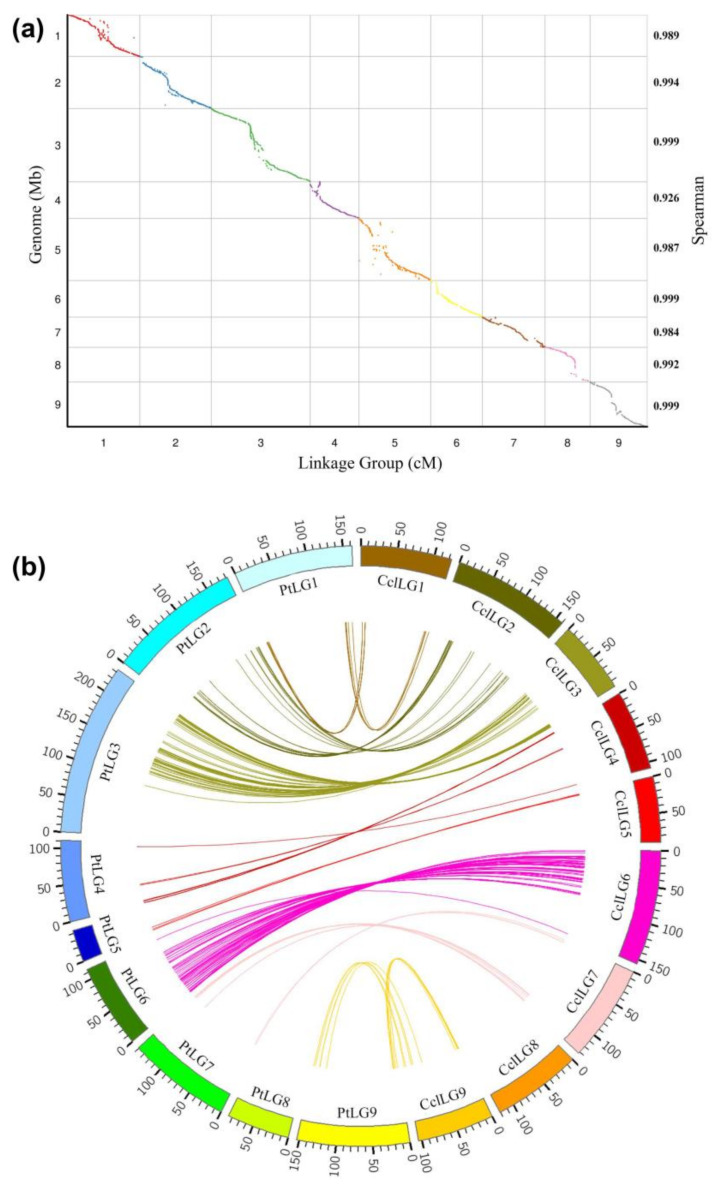
Figure 6.
High-density genetic linkage map construction of citrus. (a) Collinearity analysis of all citrus linkage groups with its genome sequence. The x-axis scales the genetic distance of citrus LGs accordingly: the left y-axis represents the position of citrus pseudo-chromosomes and the right y-axis represents the Spearman correlation coefficient. SLAF markers in these LGs are plotted as dots. (b) Conservation of the synteny and linear order of markers between the female and male parent. Each colored arc represents an orthologous match between two species. Ccl: Clementine mandarin, Pt: Poncirus trifoliata.

