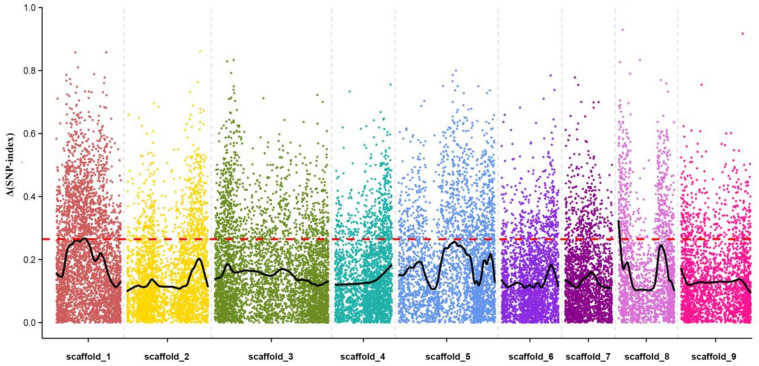
Figure 7.
QTL mapping of the leaf abscission trait using the mutmap strategy. The x-axis represents each scaffold of citrus and each colored dot represents an SNP marker. The y-axis represents a Δ(SNP-index) value corresponding to the association degree, the threshold of Δ(SNP-index) value is marked by a red dotted line, and values higher than it were regarded as traits associated with candidate regions.

