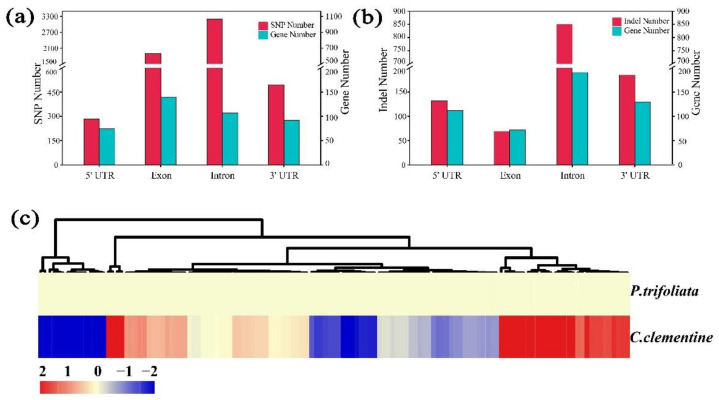
Figure 9.
Genetic variation and expression analysis of the candidate genes. (a) Numbers of SNP in the candidate genes. (b) Numbers of InDel in the candidate genes. (c) Heat map of the candidate genes using data from a previous study [33]. Genes highly or weakly expressed in the tissues of mature leaf are colored red and blue, respectively. The heat map was generated using the Cluster 3.0 software. Note: the leaves of the parents were collected at the same developmental stage. Mature leaves represent fully developed leaves rather than senescent and yellowed leaves.

