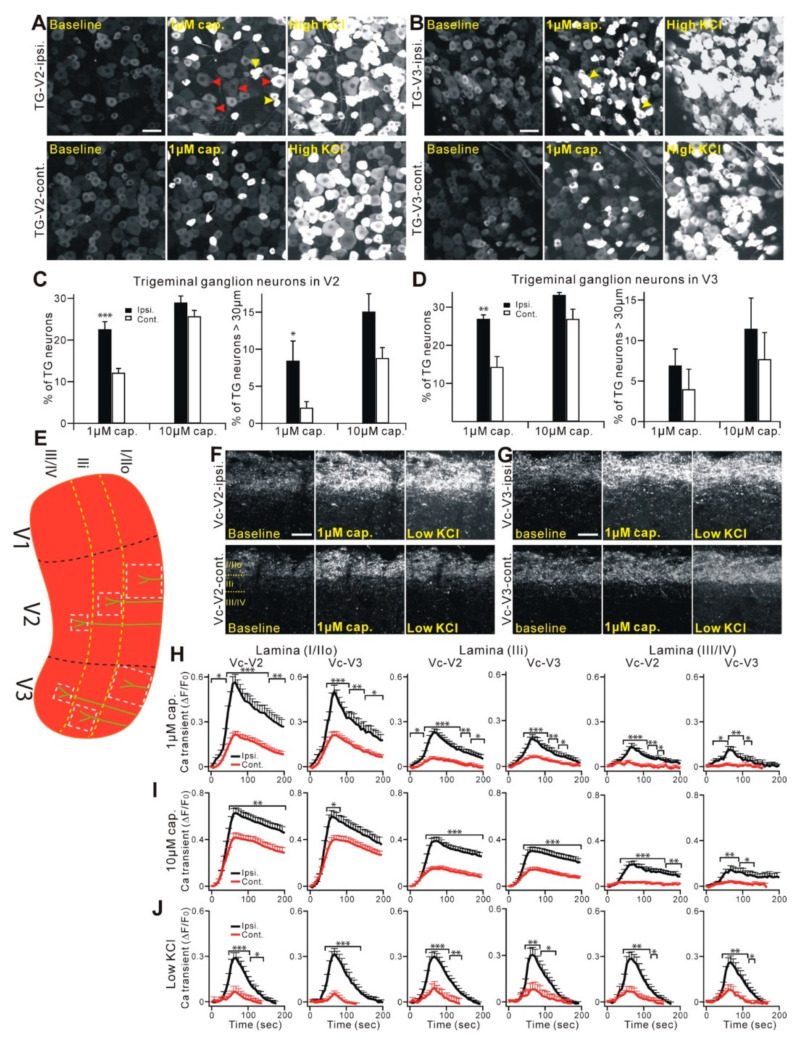
Figure 5.
Functional plasticity changes of the trigeminal nociceptors following a craniofacial neuropathic injury. (A,B) Representative GCaMP3 imaging of TG explants from Pirt-GCaMP3 mice. TG neurons of V2 (A) or V3 (B) division after CCI-ION were activated by capsaicin (1 µM) or KCl (100 mM). Upper panels show ipsilateral a V2 (A) or V3 (B) division of TG. Lower panels show a contralateral V2 (A) or V3 (B) division of TG. Scale bar, 50 µm (for both). Arrowheads in red indicate TG neurons that are over 30 µm in diameter and activated by capsaicin. Arrowheads in yellow indicate coupled TG activation by capsaicin; that is, adjacent neurons activated together—simultaneously or in a very short time window (<1 sec). (C,D) Population data for V2 shown in (C) or for V3 shown in (D), expressed as the percentage of KCl-sensitive TG neurons. ipsi., ipsilateral; cont., contralateral. * p < 0.05; ** p < 0.01; and *** p < 0.001. Data are presented as the mean ± SEM. (E) Schematic diagram of a mouse Vc. Black dashed lines indicate the border of three large divisions (V1, V2, and V3) in Vc. White square dash lines indicate where the region of the nerve fibers and terminals [74] was selected and analyzed, in order to measure the Ca2+ transient at different lamina (yellow dash lines). (F,G) Representative GCaMP3 imaging of Vc slices from Pirt-GCaMP3 mice. Central fibers and terminals in the V2 (F) or V3 (G) division of Vc after CCI-ION were activated by capsaicin (1 µM) or 20-mM KCl. The upper panels show the ipsilateral V2 (F) or V3 (G) division of Vc. The lower panels show the contralateral V2 (F) or V3 (G) division of Vc. Scale bar, 50 µm. (H–J) Time course of the amplitude of the Ca2+ transient evoked by capsaicin (1 µM and 10 µM) or KCl (20 mM) applications at different lamina (lamina I/IIo, IIi, and III/IV) of V2 and V3 of the Vc. Capsaicin was applied in a bath from 0 to 60 s during the time course. The Ca2+ transient (∆F/F0) was normalized to the value imaged at the baseline. Ipsi., ipsilateral; cont., contralateral. * p < 0.05, ** p < 0.01, and *** p < 0.001. Data are presented as the mean ± SEM. The data and images were redrawn using previously published data from Kim et al. [70].

