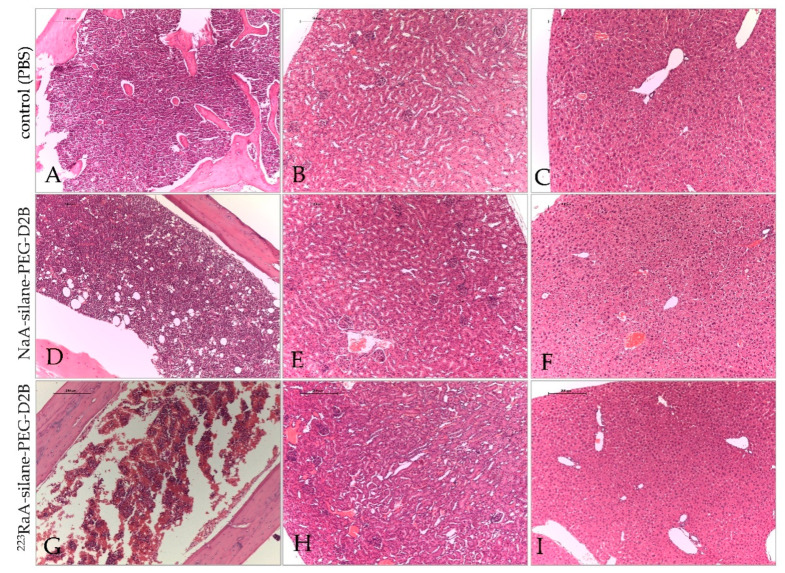
Figure 8.
Representative images of bone marrow, kidneys and liver sections after exposure of BALB/c mice to NaA-silane-PEG-D2B and 223RaA-silane-PEG-D2B for 7 days. Bone marrow (A), kidneys (B) and liver (C) sections from control (PBS) mice. Bone marrow (D), kidneys (E) and liver (F) sections from mice after exposure to NaA-silane-PEG-D2B. Bone marrow (G), kidneys (H) and liver (I) sections from mice after exposure to 223RaA-silane-PEG-D2B. Scale bars, 200 mcm.

