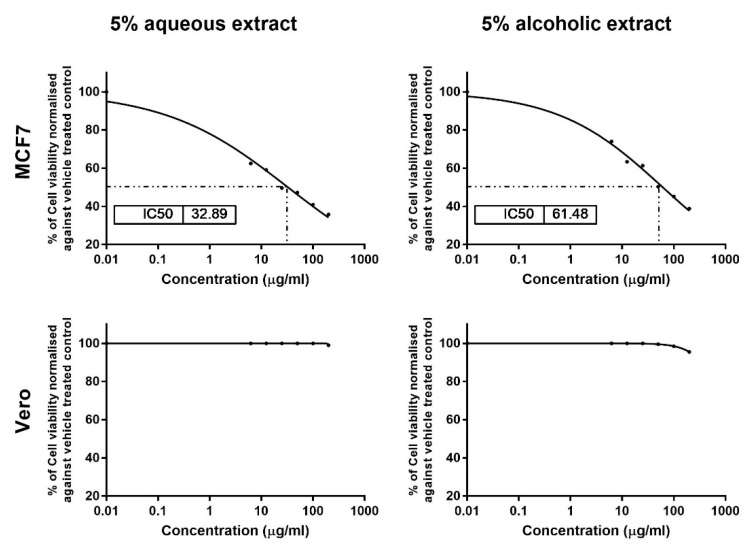
Figure 3.
Cytotoxicity analysis of the 5% larval extracts using the MTT assay. Dose–response curves show the effect of the two extracts on MCF7 and Vero viability and the obtained IC50 after 24 h. Data were normalized to untreated control cells and expressed as the mean % viability ± SEM. Samples on MCF7 and Vero were run in triplicate in three independent experiments, n = 5.

