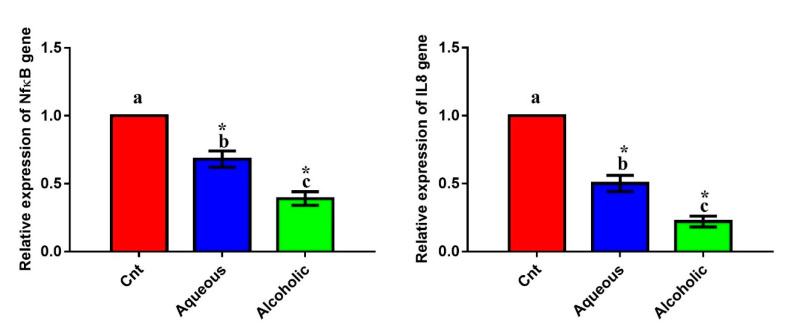
Figure 8.
Expression of NFκB and IL8 genes in MCF7 cells following treatment with 5% larval aqueous and alcoholic extracts. Data are expressed as the mean ± SEM. Samples were run in triplicate in three independent experiments, n = 5. Groups with different letters are significantly different at p < 0.05. * indicates high significance with respect to the control (p < 0.01).

