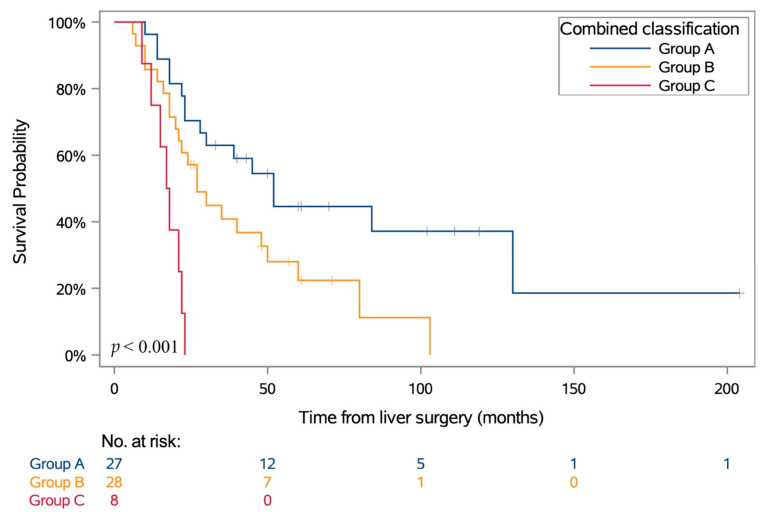
Figure 3.
OS according to combined classification based on genetic risk and MRI melanin quantification. p values were calculated using log-rank test. Group A refers to D3/8nl, D3/8g or M3/8nl; Group B refers to M3/8g abnormalities and mT1s ≤ 1.1; Group C refers to M3/8g abnormalities and mT1s > 1.1.

