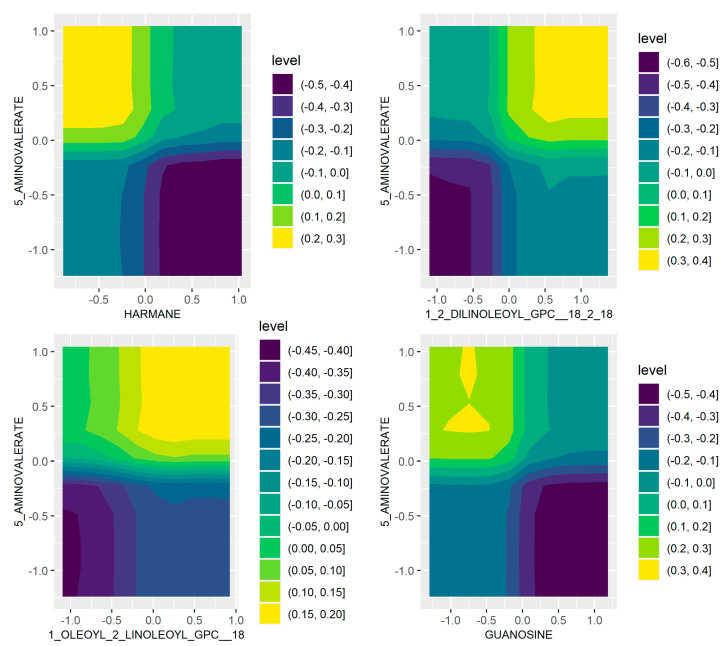
Figure 2.
Partial dependence on CRC for representative pairs of microbial/metabolomic features, shown as contour plots, coloured by log-odds of CRC. Higher values (yellow) indicate increased risk of CRC; lower values (blue) indicate decreased risk of CRC; a value of 0 indicates the risks are equal. Plots for more feature pairs can be found in Supplementary Figure S2. Top to bottom: (5-aminovalerate, harmane), (5-aminovalerate, 1,2-Dilinoleoyl-GPC), (5-aminovalerate, 1-oleoyl-2-linoleoyl-GPC), (guanosine, 5-aminovalerate).

