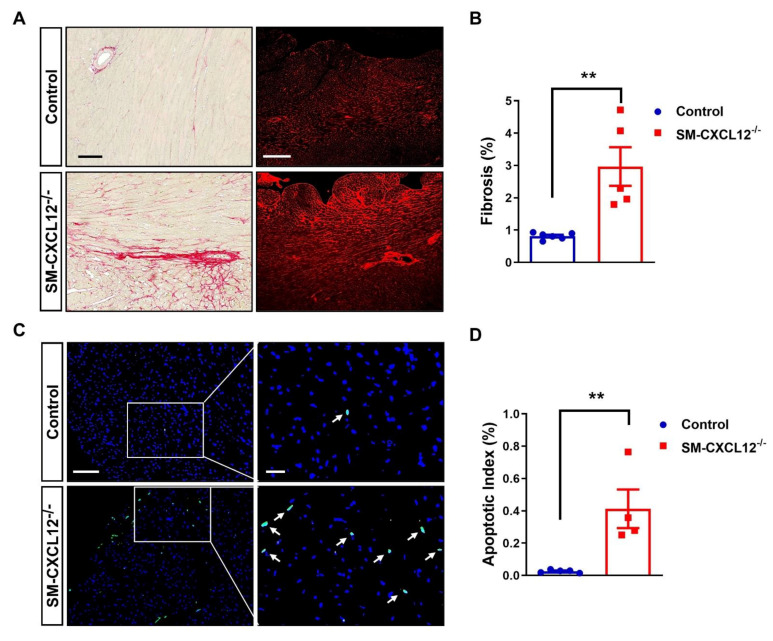
Figure 3.
SM-CXCL12−/− mice revealed increased cardiac fibrosis, apoptosis. (A) Representative Sirius red and WGA stainings of heart sections from WT and cKO mice (left panel), scale bar represents 100 and 200 µm. (B) Bar graph showing quantification of the ratio of myocardial fibrosis area to total myocardial area in histological sections (right panel; n = 5–6), ** p < 0.01 from Student’s t-test (C) Representative co-staining of TUNEL+ (bright green nuclei marked by arrows) and DAPI+ (blue nuclei) cells in WT and cKO mice (left panel), Scale bar represents 100 and 25 µm. (D) Bar graph showing quantification of the percentage of TUNEL+ apoptotic nuclei to total nuclei (right panel; n = 4–5), ** p < 0.01 from Student’s t-test. Data represent mean ± SD.

