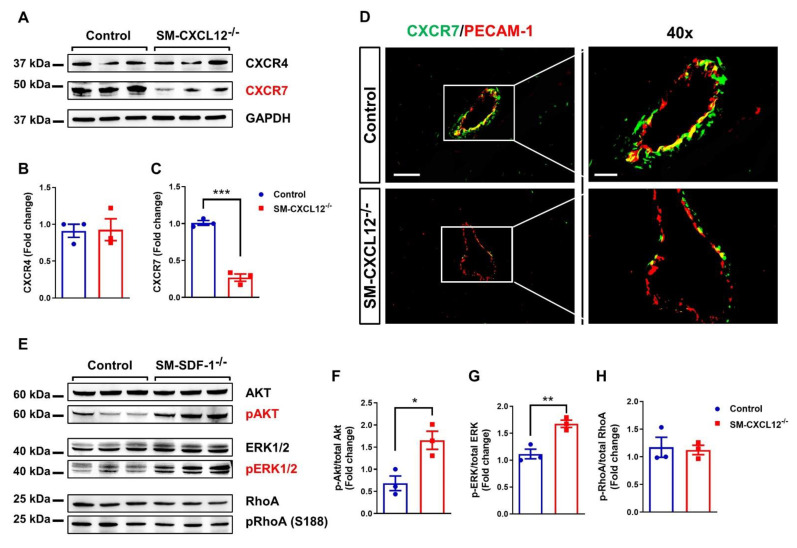
Figure 7.
Decreased CXCR7 expression and activation of AKT and ERK1/2 signaling pathways in hypertrophic cKO hearts. (A–C) Representative Western blot analysis and bar graphs showing the quantification of CXCR4 and CXCR7 protein levels in heart lysates of control and cKO mice. *** p < 0.001 from Student’s t-test. GAPDH was used as reference protein, n = 3. (D) Heart sections of mice immunolabeled with antibodies against CXCR7 (green) and the endothelial cell marker PECAM-1 (red). Scale bar, 200 and 20 µm. (E–H) Western blot analyses and bar graphs represent the quantification of phosphorylated and total protein levels of AKT, ERK1/2, and RhoA in mouse hearts of control and SM-CXCL12−/− mice, n = 3. * p < 0.05, ** p < 0.01 from Student’s t-test. Data represent mean ± SD.

